The views expressed here are my own, not those of my employers.
Summary
- Our World in Data (OWID) has a post showing the number of democracies, people living in them, and democracy indices weighted by population have recently gone down. I think economic size is a better proxy for influence than the number of countries or population, so I looked into the variation of democracy indices weighted by nominal and real gross domestic product (GDP)
- I studied Varieties of Democracy’s electoral democracy index, Polity’s democracy index, and Economist Intelligence Unit’s democracy index.
- I concluded:
- The indices weighted by real GDP are lower than those weighted by GDP.
- The indices weighted by nominal and real GDP have also recently decreased, which has mostly been driven by wealthy democratic countries.
Introduction
OWID has a post showing the number of democracies, people living in them, and democracy indices weighted by population have recently gone down. I think economic size is a better proxy for influence than the number of countries or population, so I looked into the variation of democracy indices weighted by nominal and real GDP.
Methods
I weighted by nominal and real GDP 3 of the 4 main quantitative indices of OWID’s Democracy Data Explorer:
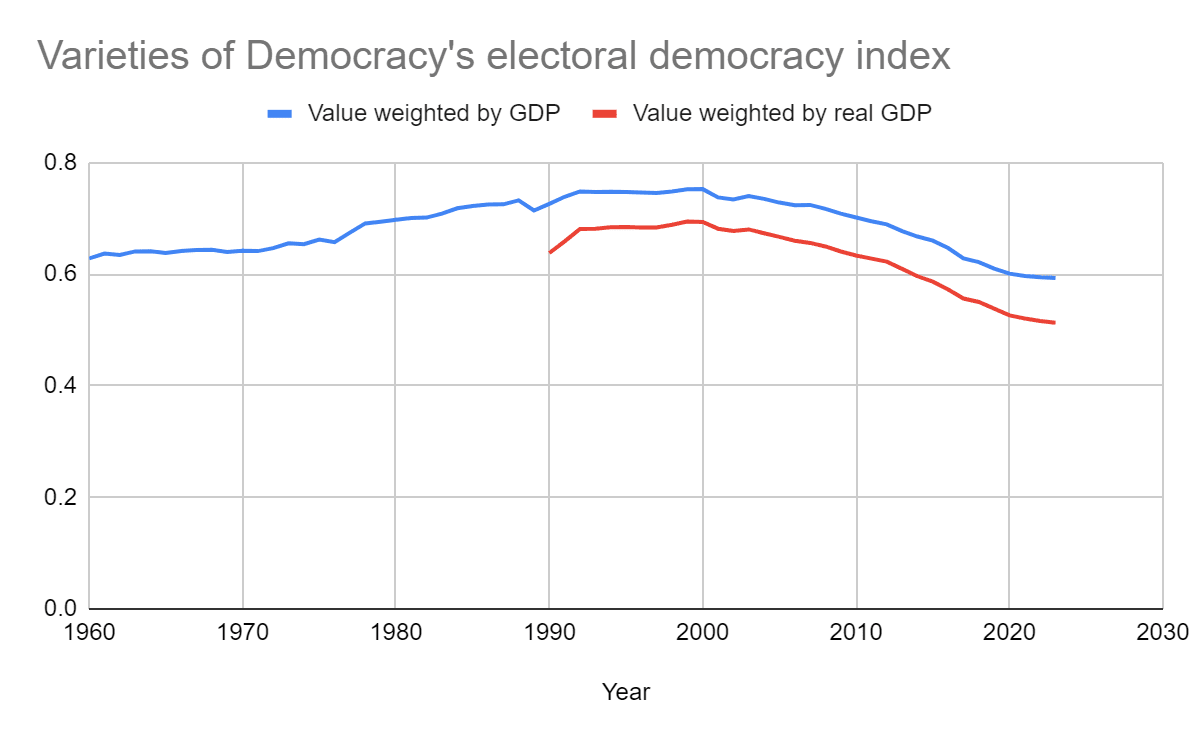
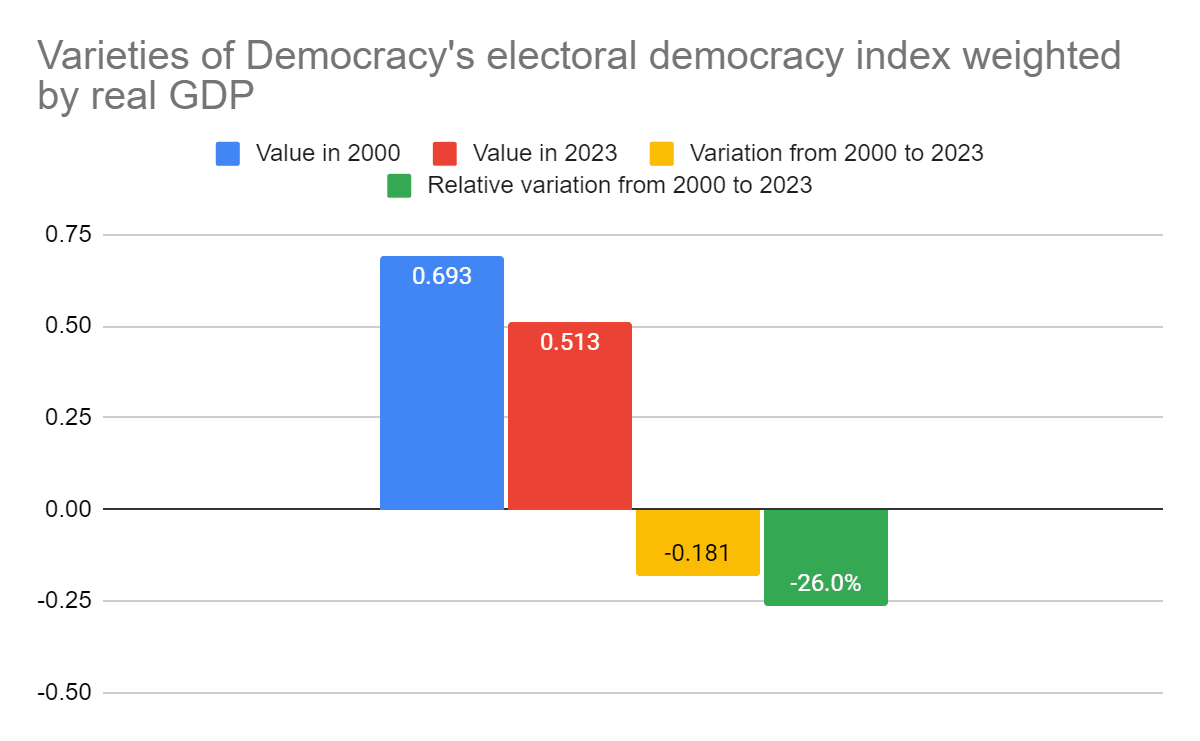
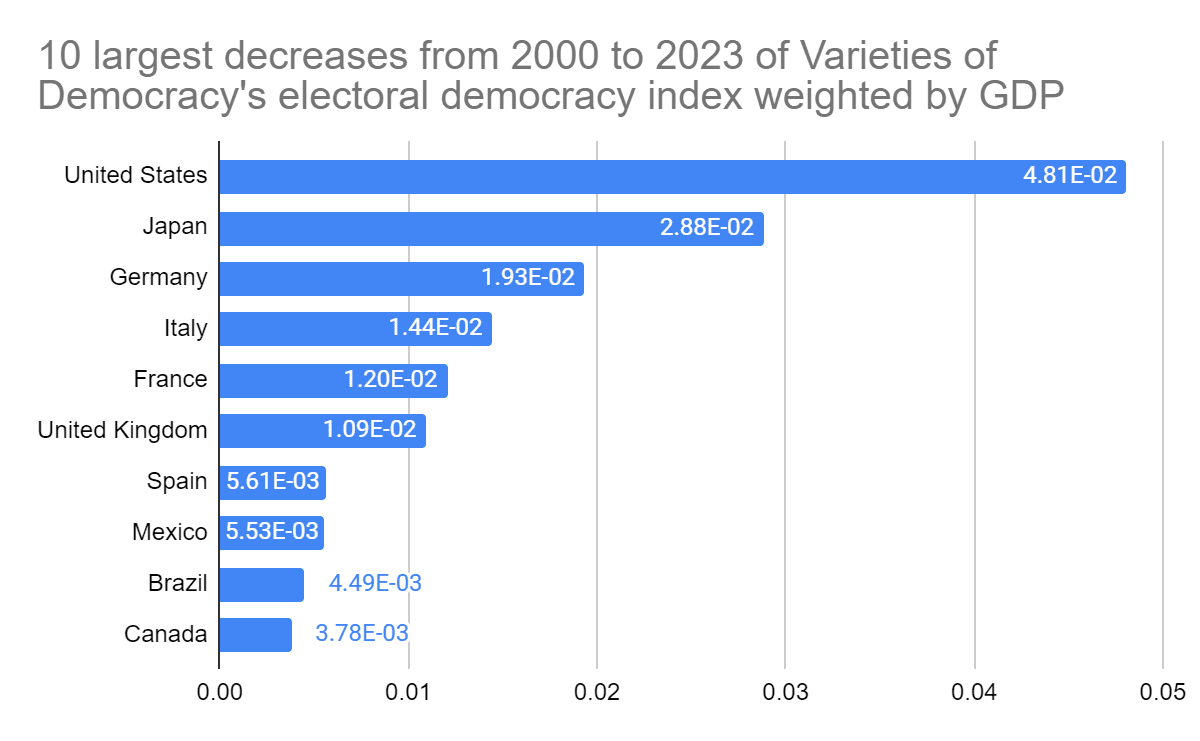
- Varieties of Democracy’s electoral democracy index.
- “It captures to which extent political leaders are elected under comprehensive voting rights in free and fair elections, and freedoms of association and expression are guaranteed”.
- “It ranges from 0 to 1 (most democratic)”.
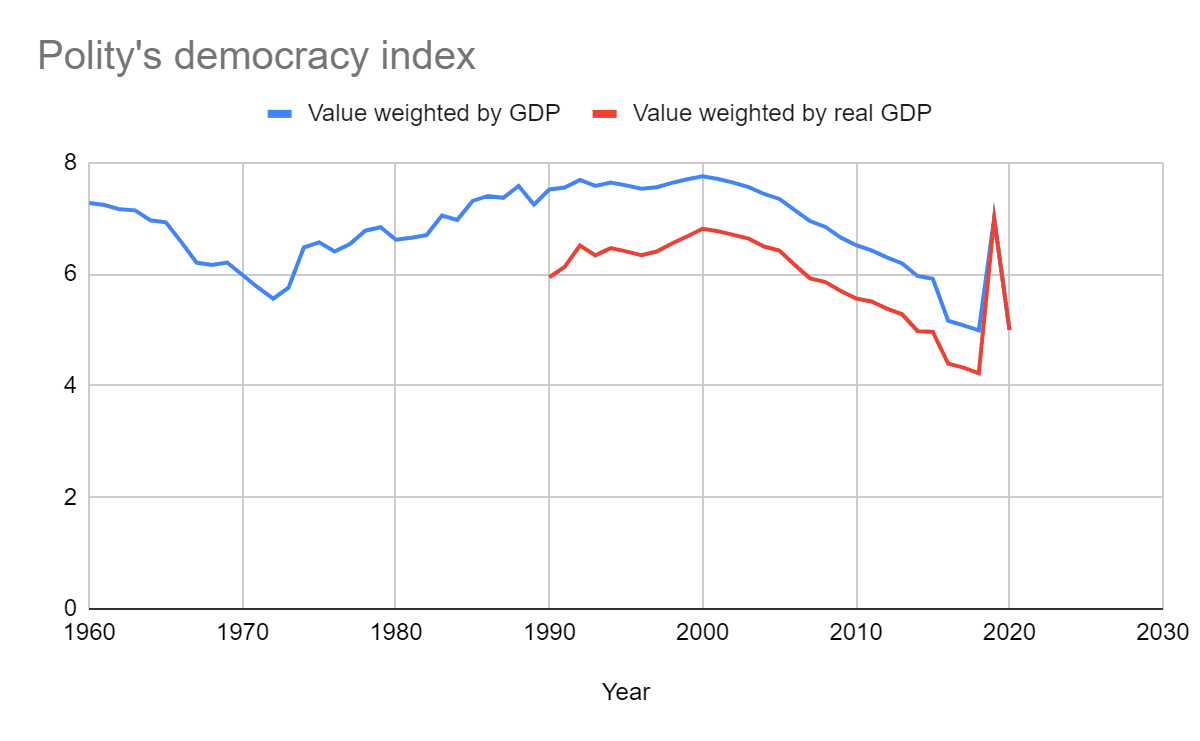
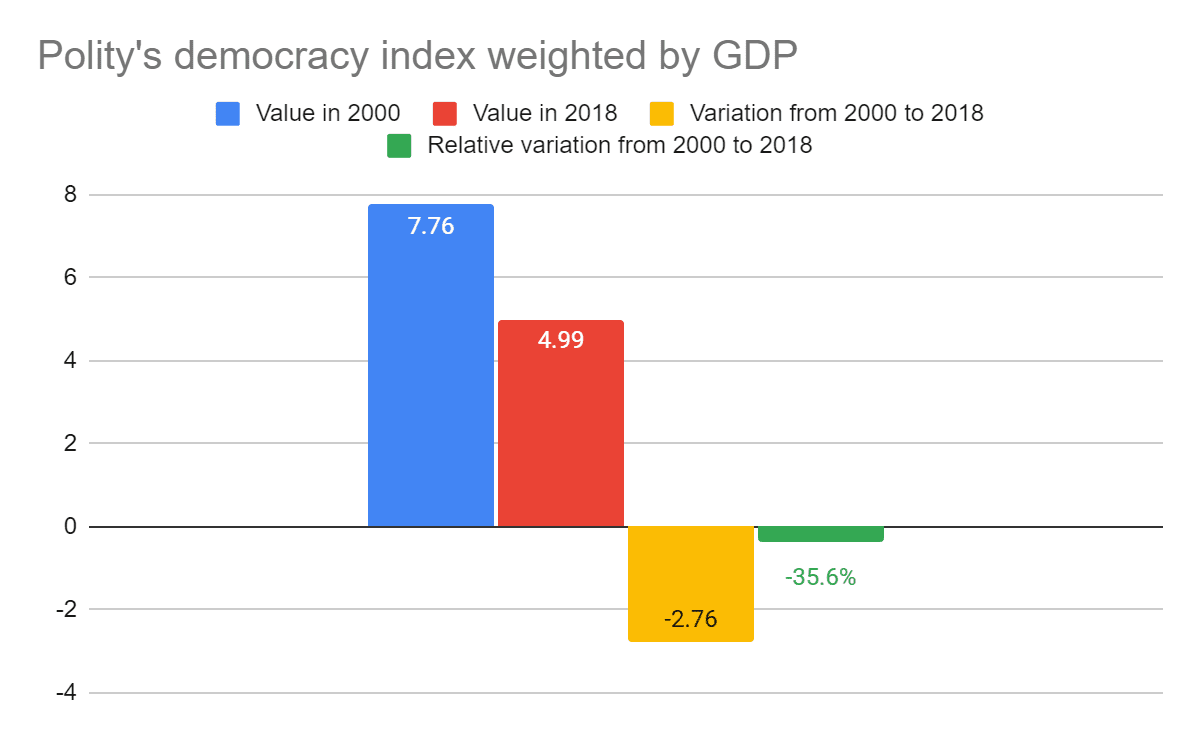
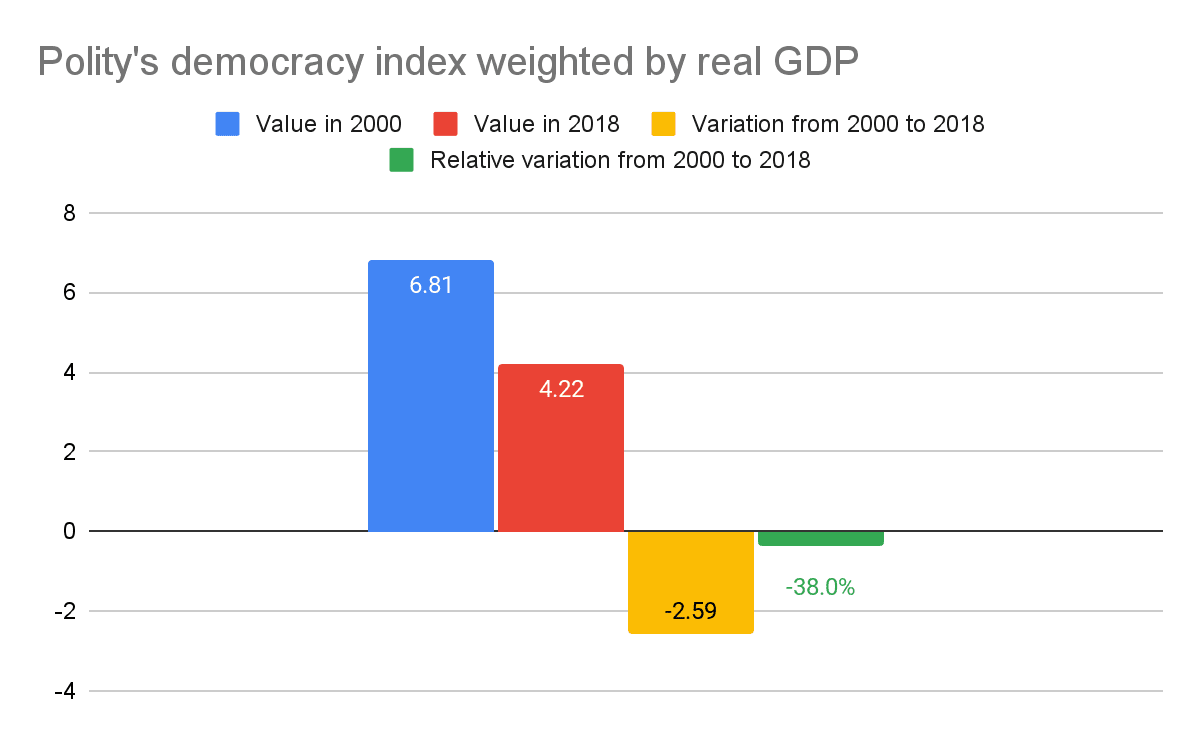
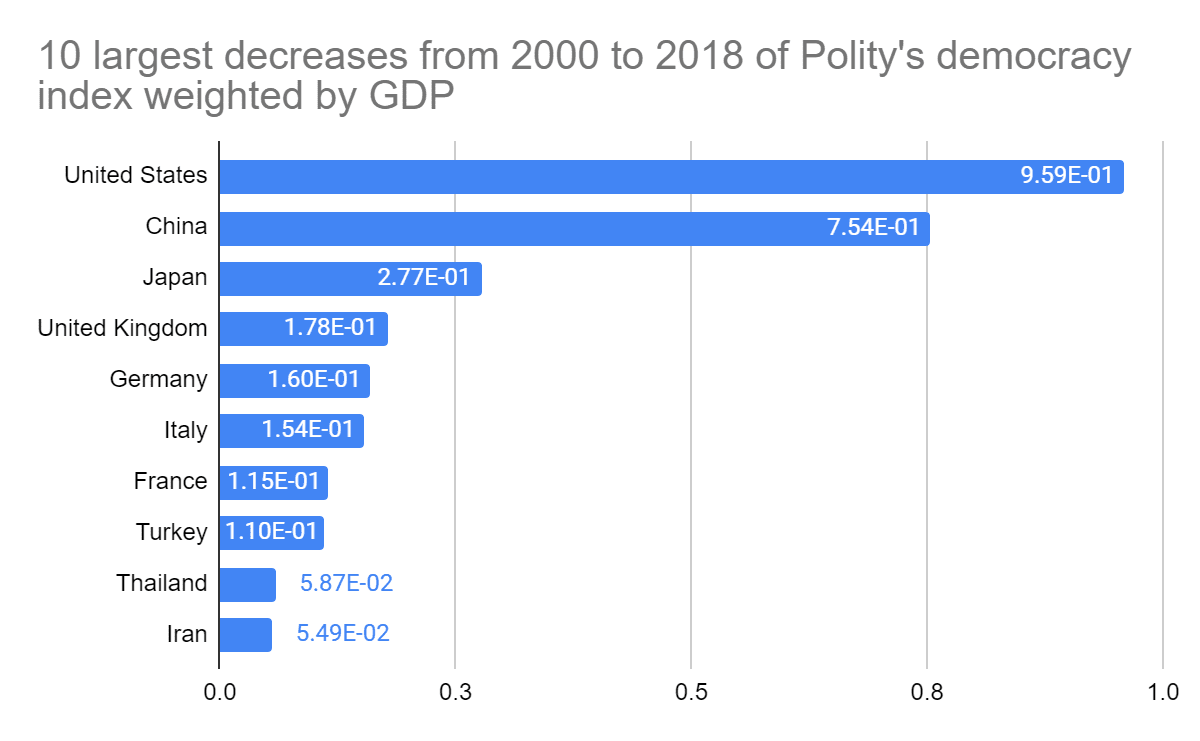
- Polity’s democracy index.
- “It captures the extent to which open, multi-party, and competitive elections choose a chief executive who faces comprehensive institutional constraints, and political participation is competitive”.
- “It ranges from -10 to 10 (fully democratic)”.
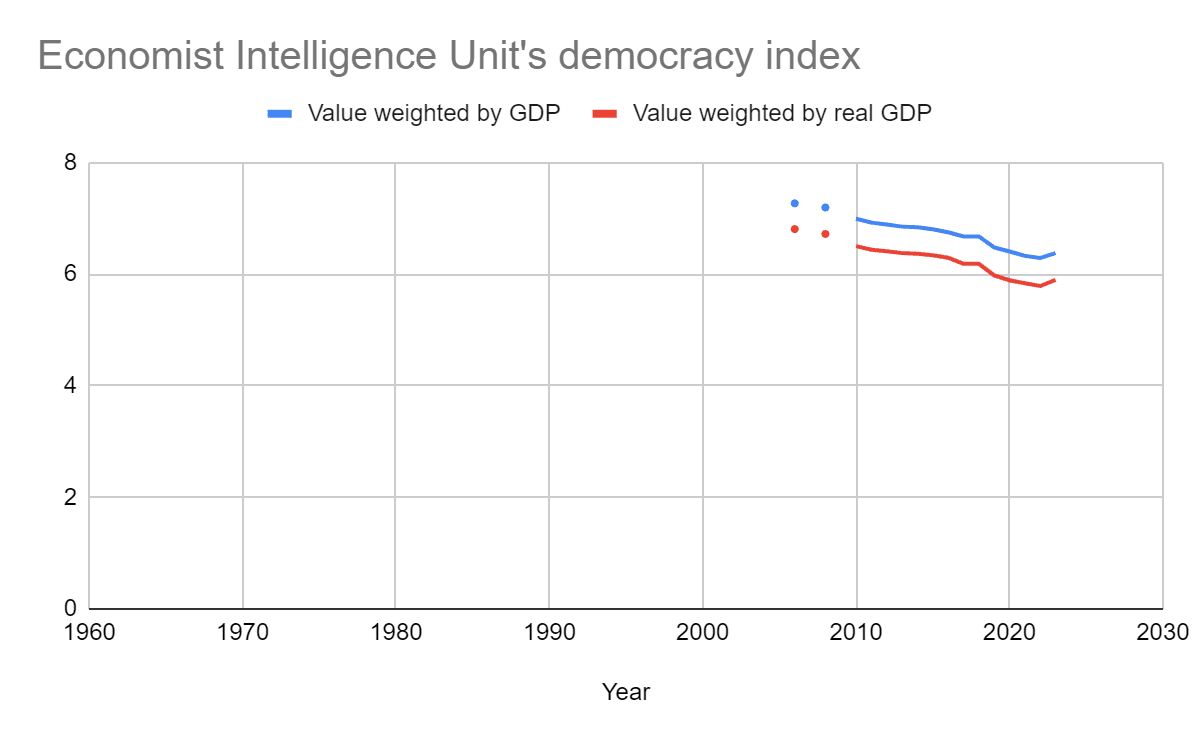
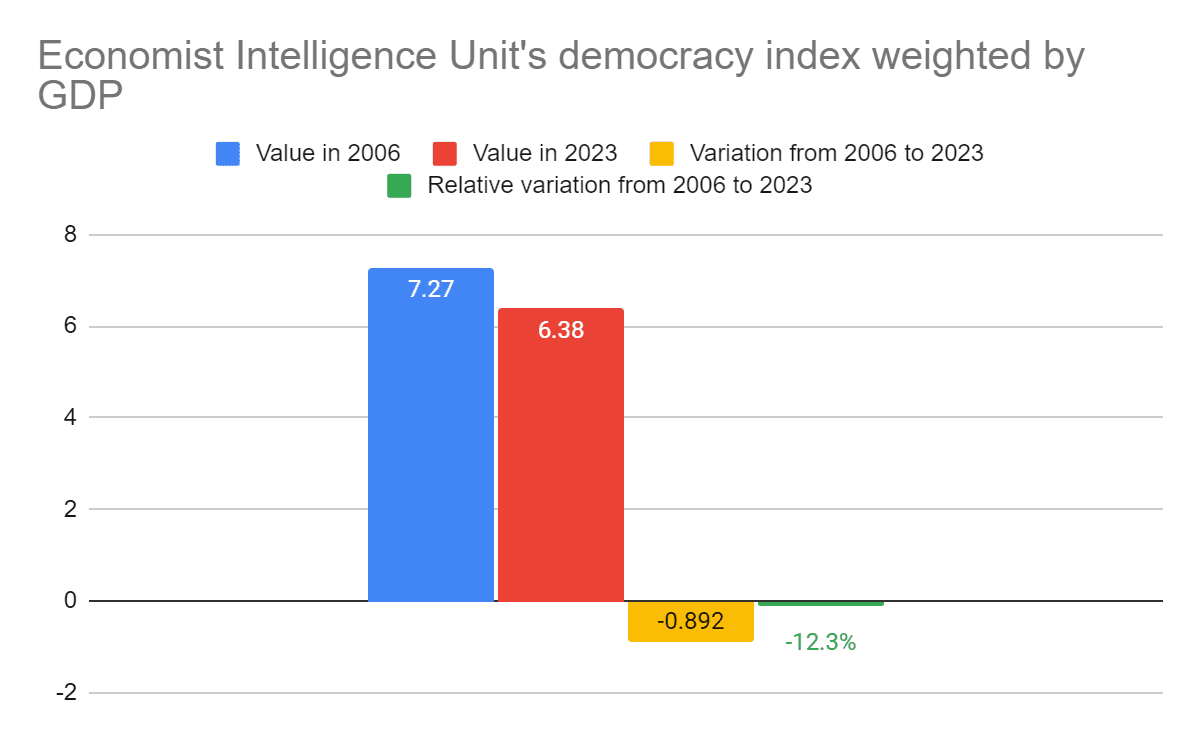
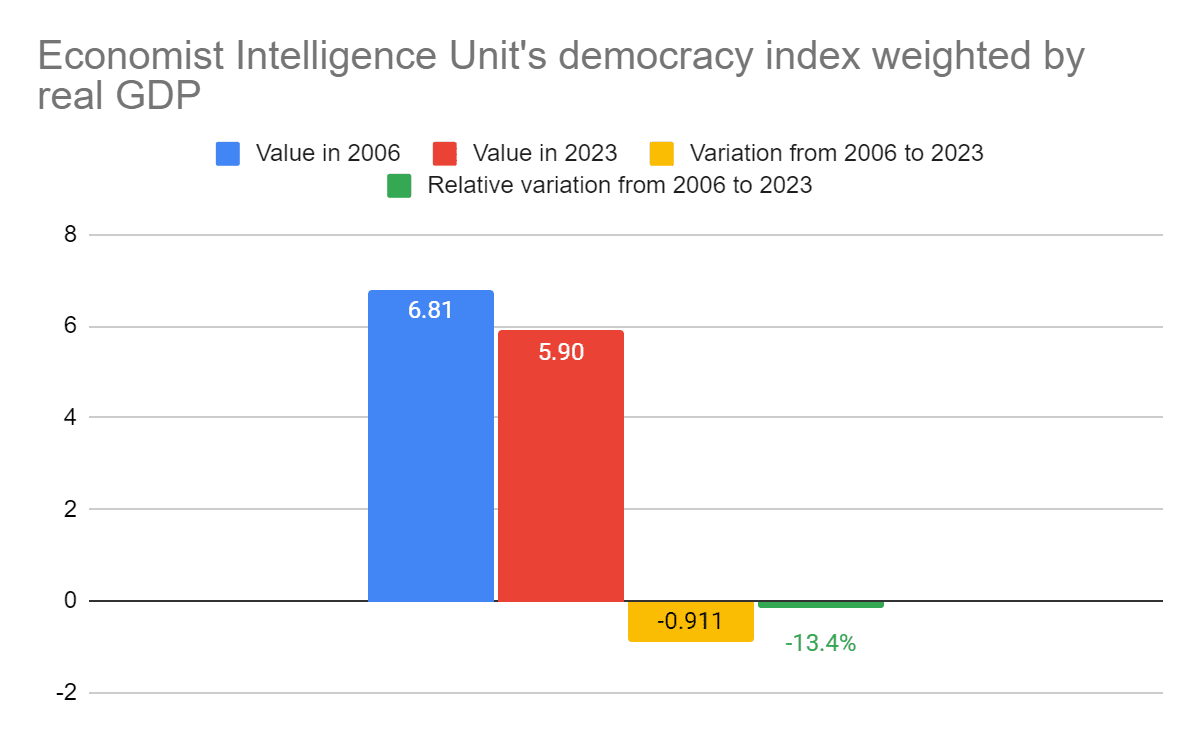
- Economist Intelligence Unit’s democracy index.
- “It combines information on the extent to which citizens can choose their political leaders in free and fair elections, enjoy civil liberties, prefer democracy over other political systems, can and do participate in politics, and have a functioning government that acts on their behalf”.
- “It ranges from 0 to 10 (most democratic)”.
I did not analyse the other main quantitative index, Bertelsmann Transformation Index’s democratic features, because it does not have data for most of Europe, North America nor Oceania.
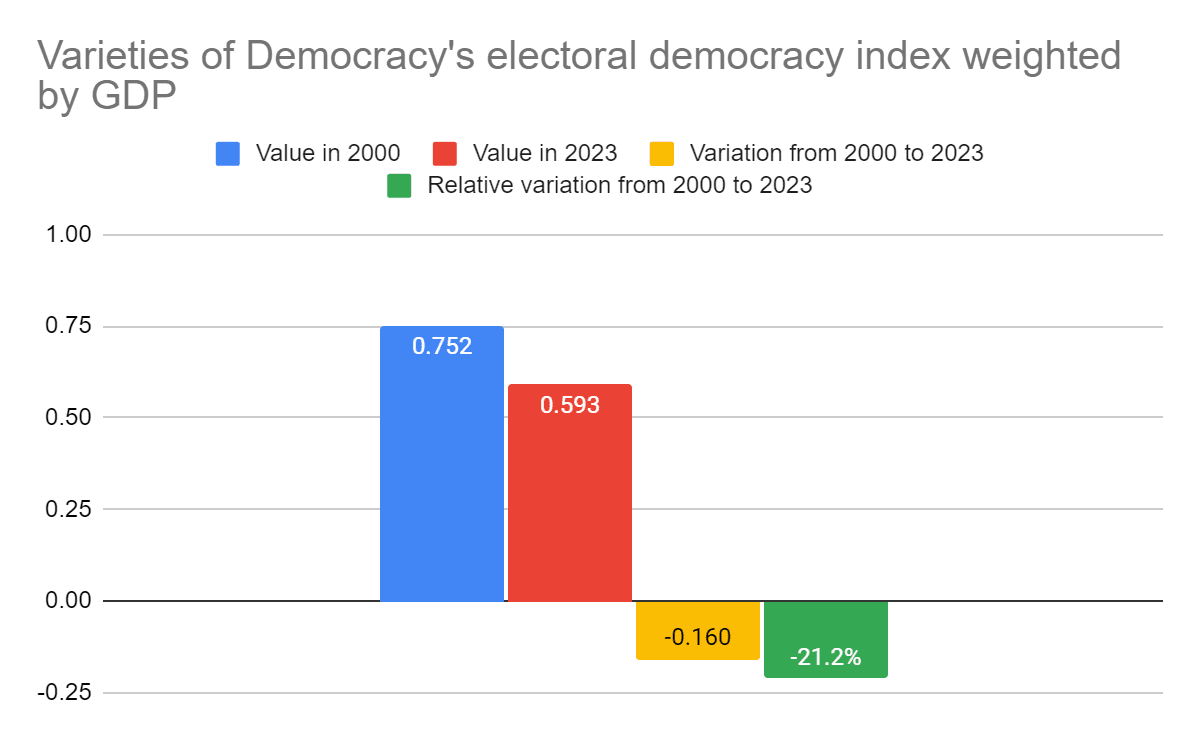
I also studied the recent variations in the weighted indices, setting the start and end years to the earliest and latest for which there was data since 2000.
Results
The data and results are in this Sheet.
Time series
Recent variations
Drivers of the recent decreases
Discussion
Some takeaways:
- The indices weighted by real GDP are lower than those weighted by GDP.
- The weighted indices have recently decreased from 12.3 % to 38.0 %.
- The recent decreases in democracy indices weighted by nominal and real GDP have mostly been driven by wealthy democratic countries.
- The decrease in Varieties of Democracy’s electoral democracy index weighted by GDP was mostly driven by the United States, Japan and Germany, which had the 1st, 3rd and 4th highest GDP in 2023.
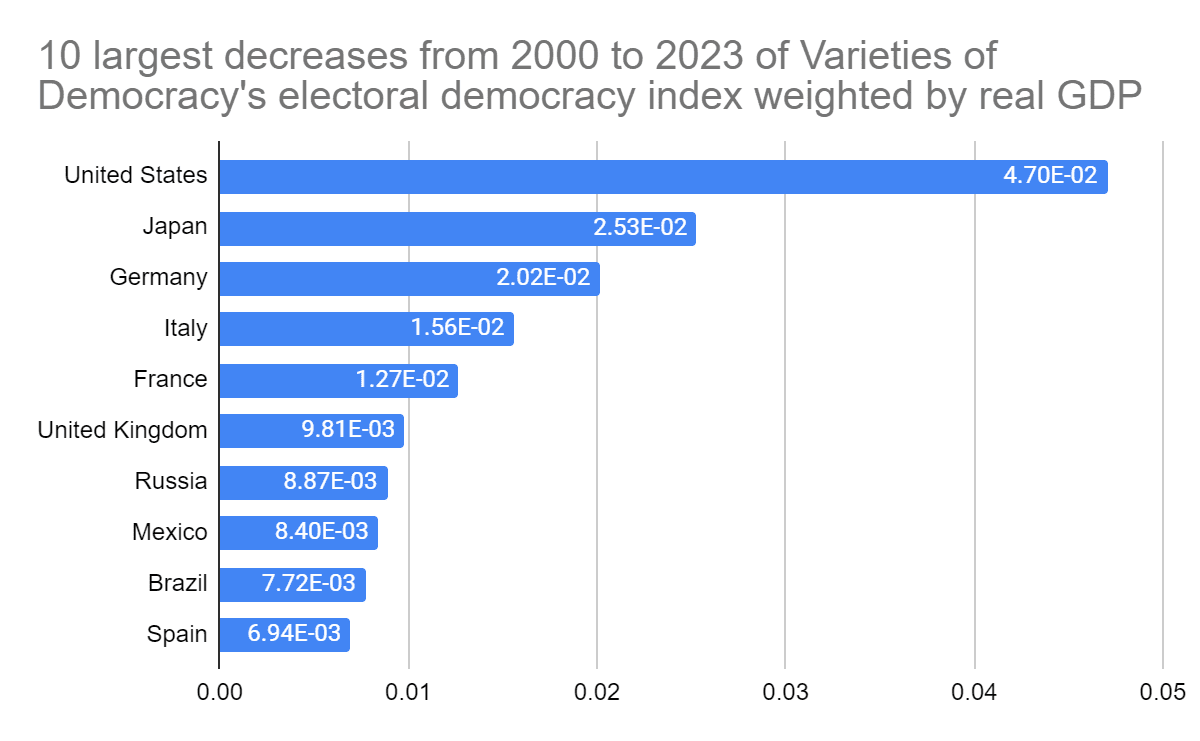
- The decrease in Varieties of Democracy’s electoral democracy index weighted by real GDP was mostly driven by the United States, Japan and Germany, which had the 2nd, 5th and 6th highest real GDP in 2023.
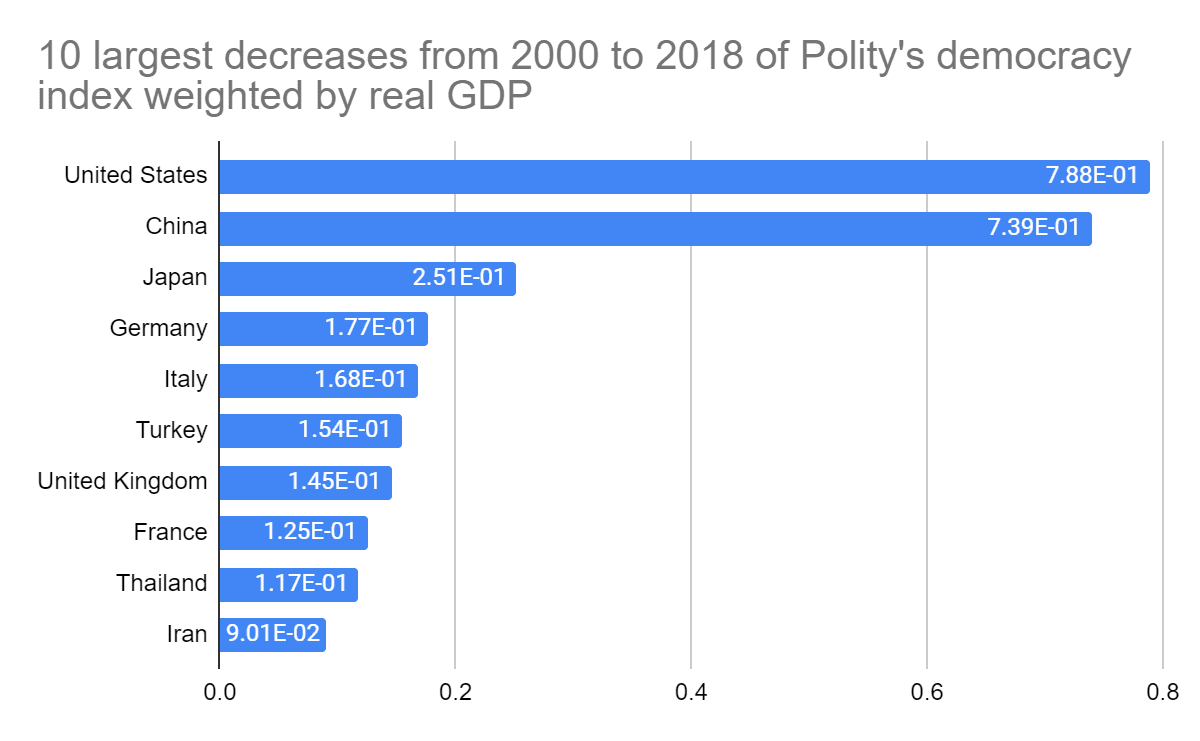
- The decrease in Polity’s democracy index weighted by GDP was mostly driven by the United States, China and Japan, which had the 1st, 2nd and 3rd highest GDP in 2023.
- The decrease in Polity’s democracy index weighted by real GDP was mostly driven by the United States, China and Japan, which had the 2nd, 1st and 6th highest real GDP in 2023.
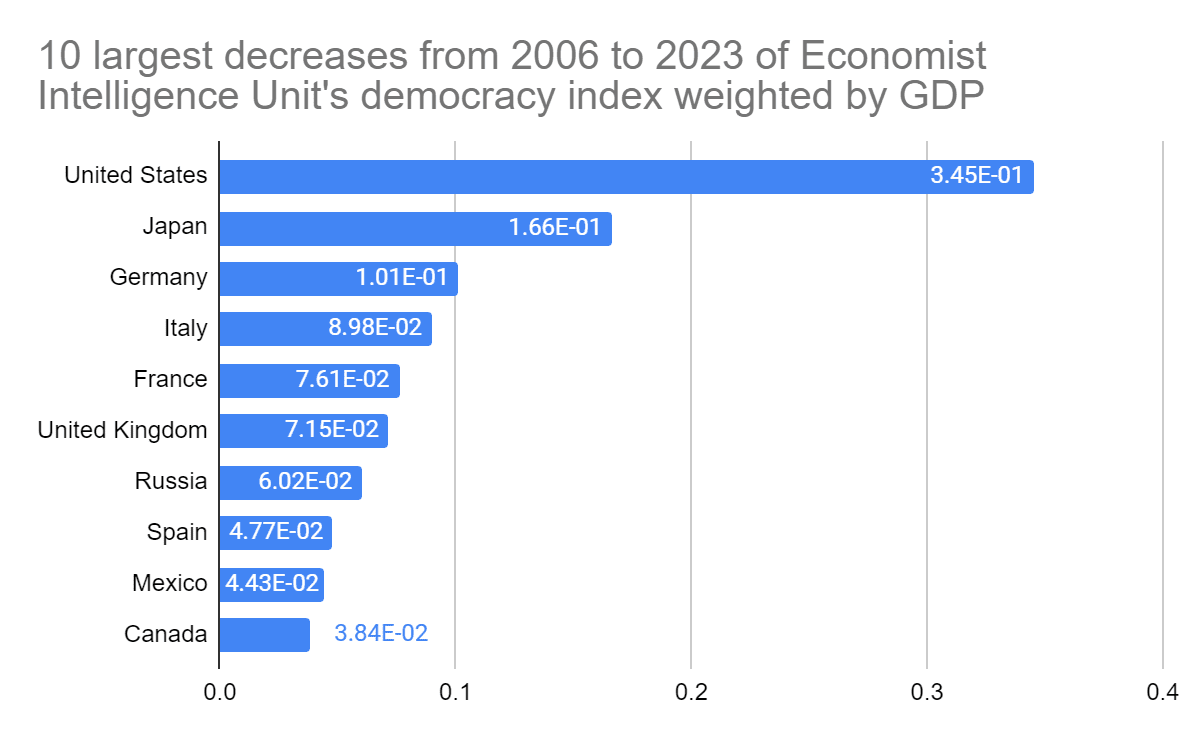
- The decrease in Economist Intelligence Unit’s democracy index weighted by GDP was mostly driven by the United States, Japan and Germany, which had the 1st, 3rd and 4th highest real GDP in 2023.
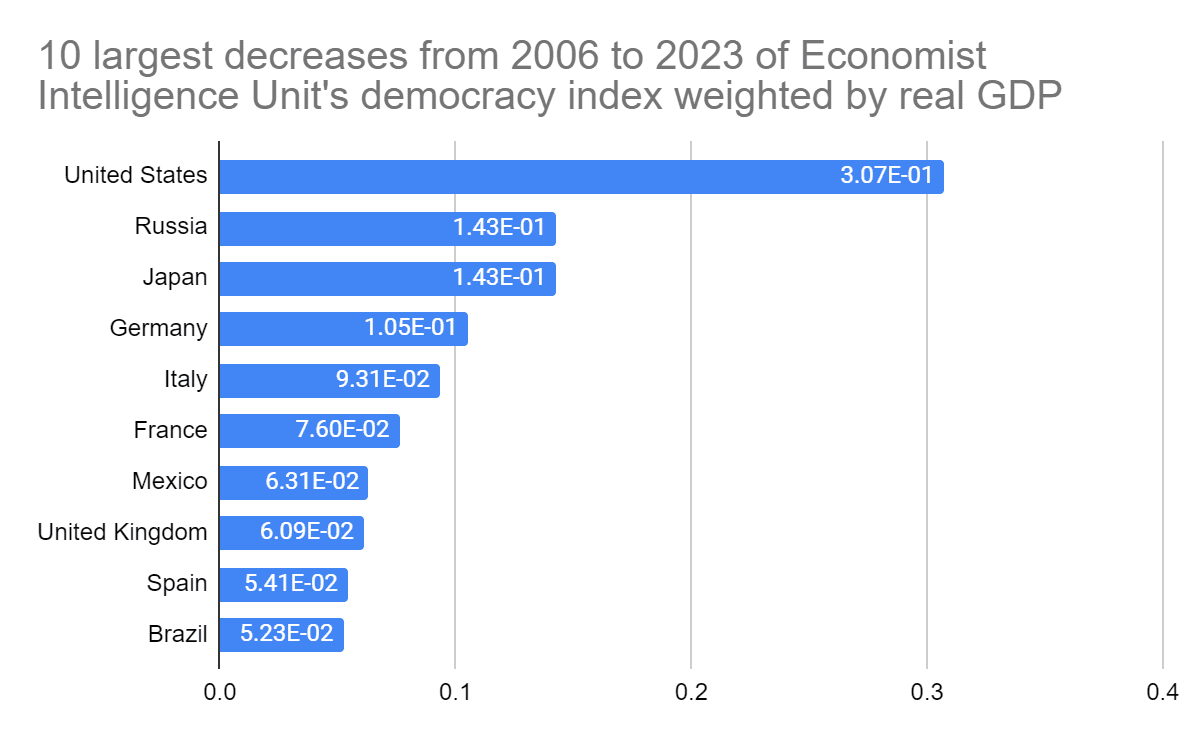
- The decrease in Economist Intelligence Unit’s democracy index weighted by real GDP was mostly driven by the United States, Russia and Japan, which had the 2nd, 4th and 5th highest GDP in 2023.
- The contribution of wealthy democratic countries to the decreases may be underestimated to the extent authoritarian countries overstate their nominal and real GDP, which would imply democratic countries being weighted more heavily.