This paper has in its conclusion that: "results indicate a slowdown and eventual halt in growth within the next decade or so but leave open whether the subsequent decline will constitute a collapse". This seems prima facie implausible to me but I couldn't find any critiques to this paper so any thoughts as to why this paper is wrong, right or inconclusive would be appreciated or alternatively a pointer to a good critique.
Hide table of contents
Reactions
New Answer
New Comment
2 Answers sorted by
The original "Limits to Growth" report was produced during the 1970s amid an oil-price crisis and widespread fears of overpopulation and catastrophic environmental decline. (See also books like "The Population Bomb" from 1968.) These fears have mostly gone away over time, as population growth has slowed in many countries and the worst environmental problems (like choking smog, acid rain, etc) have been mitigated.
This new paper is taking a 1972 computer model of the world economy and seeing how well it matches current trends. They claim the match is pretty good, but they don't actually just plot the real-world data anywhere, they merely claim that the predicted data is within 20% of the real-world values. I suspect they avoided plotting the real-world data because this would make it more obvious that the real world is actually doing significantly better on every measure. Look at the model errors ("∆ value") in their Table 2:
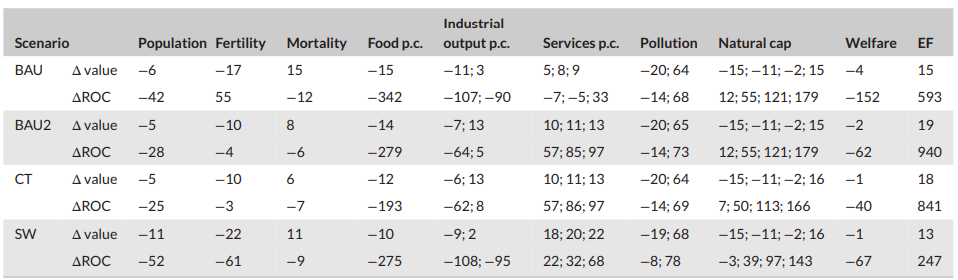
So, compared to every World3-generated scenario (BAU, BAU2, etc), the real world has:
- higher population, higher fertility, lower mortality (no catastrophic die-offs)
- more food and higher industrial output (yay!)
- higher overall human welfare and a lower ecological footprint (woohoo!)
The only areas where humanity ends up looking bad are in pollution and "services per capita", where the real world has more pollution and fewer services than the World3 model. But on pollution, the goal-posts have been moved: instead of tracking the kinds of pollution people were worried about in the 1970s (since those problems have mostly been fixed), this measure has been changed to be about carbon dioxide driving climate change. Is climate change (which is predicted by other economists and scientists to cut a mere 10% of GDP by 2100) really going to cause a total population collapse in the next couple decades, just because some ad-hoc 1970s dynamical model says so? I doubt it. Meanwhile, the "services per capita" metric represents the fraction of global GDP spent on education and health -- perhaps it's bad that we're not spending more on education or health, or perhaps it's good that we're saving money on those things, but either way this doesn't seem like a harbinger of imminent collapse.
Furthermore, the World3 model predicted that things like industrial output would rise steadily until they one day experienced a sudden unexpected collapse. This paper is trying to say "see, industrial output has risen steadily just as predicted... this confirms the model, so the collapse must be just around the corner!" This strikes me as ridiculous: so far the model has probably underperformed simple trend-extrapolation, which in my view means its predictions about dramatic unprompted changes in the near future should be treated as close to worthless.
Personally, I'm more worried about this paper. Here is a vox writeup. I don't know that I think the linear growth story is true, and even if it was we could easily hit another break point (AI anyone?), but I'm more worried about this kind of decline than a blowup like LTG suggests.
I'm not an expert in this area, but think the paper you're pointing to is leaning way too hard on a complicated model with a bad track record, and I'm weirded out by how little they compare model predictions and real data (eg using graphs). If I wanted to show off how awesome some model was, I'd be much more transparent
(note: Jackson makes a similar point re: lack of transparency).
Curated and popular this week
Thank you for the detailed answer!