Crossposted to LessWrong.
Over the last few years, progress has been made in estimating the density of Space-Faring Civilizations (SFCs) in the universe, producing probability distributions better representing our uncertainty (e.g., Sandberg 2018, Snyder-Beattie 2021, Hanson 2021, etc.). Previous works were mainly limited to point estimates and often only focused on the Milky Way. Furthermore, some recent works explore the impact of using different anthropic theories (SSA, SIA, ADT)(e.g., Finnveden 2019, Olson 2020, Olson 2021, Cook 2022). In this post, we review these recent works, the models they use, the likelihood distribution over SFC density they produce, how to compare them, which are bullish/bearish estimates, and finally, we plot them together.
Sequence: This post is part 2 of a sequence investigating the longtermist implications of alien Space-Faring Civilizations. Each post aims to be standalone. You can find an introduction to the sequence in the following post.
Summary
Models estimating the density of Space-Faring Civilizations (SFCs) can be classified along three dimensions: appearance models (try-once steps, or time-dependent steps), propagation models (no propagation/steady state, or greedy propagation/dynamic), and anthropic theories (non-anthropic, SSA, SIA, ADT). Combining the first two dimensions, we classify models into four groups: Drake-equations, Drake-equations plus propagation, Bayesian analyses of occurrence time, and Grabby aliens models. After comparing three existing distribution estimates and converting them to a common unit (peak cosmic SFC density per observable universe volume), Finnveden 2019 emerges as the most bearish estimate due to its very conservative prior for the rate of life emergence, while Cook 2022 - Balanced represents the best-guess estimate by accounting for the impact of time-dependent appearance steps and using broad best-guess priors. These works collectively suggest that while SFCs may be rare, their eventual impact on cosmic resources could be substantial depending on which anthropic theory, or absence thereof, is used.
X: Log10(peak cosmic potential SFC density per observable universe).
Today's observable universe is around 20 times larger than today's reachable universe (assuming v=c). Thus, SFCs start to overlap around X = log10(20). See the red vertical line at this value for guidance.
Classifying estimates
Three dimensions: appearance, propagation, anthropic updates. Models estimating the density of SFCs can be described as composed of three parts: appearance models, propagation models, and anthropic theory. Both models are mostly assumed to be independent and only interact via propagation suppressing appearance (preclusion). We classify existing work through these three dimensions:
Appearance models:
- Sequence of try-once steps. Note that assuming all trial environments (e.g., planets) always have the same time to pass the same steps (e.g., eukaryogenesis) renders try-once steps equivalent to try-try steps. The Drake Equation is an appearance model implicitly assuming try-once steps.
- Sequence of time-dependent steps. These models include at least some hard try-try steps and possible try-once steps, delay steps, and fuse steps. For an introduction to different kinds of steps, see Great-Filter Hard-Step Math, Explained Intuitively. For an application, see Replicating and extending the grabby aliens model.
Propagation models:
- No propagation/Steady state. SFCs are often implicitly assumed not to propagate, and/or they are assumed to be in a steady state. One of these could be true if (a) SFCs die quickly relative to astronomical scales, or (b) SFCs reliably choose not to colonize, or (c) SFCs are incapable of propagating significantly (e.g., no intergalactic travels).
- Greedy propagation. SFCs are assumed to propagate as fast as possible and suppress the appearance of new SFCs within the volume they reach.
Combining appearance and propagation models
In the following table, we name combinations of models by their popular names.
| No propagation | Greedy propagation | |
| Sequence of try-once steps | “Drake equation” | “Drake equation with dynamic propagation” |
| Sequence of time-dependent steps | “Bayesian analysis of occurrence time” | “Grabby aliens model” |
Anthropic theories:
- “Non-Anthropic” = SSA Minimum Reference Class (). Most papers (implicitly) use this theory. Note that when estimates only update on the Fermi Observation, they still implicitly choose this anthropic theory.
- SSA with Reference Class X (SSA ). is a placeholder for reference classes other than the minimum reference class, e.g., for Intelligent Civilization or for all observer moments. SSA: "All other things equal, an observer should reason as if they are randomly selected from the set of all actually existent observers (past, present, and future) in their reference class." Quote from Anthropic Bias, written by Bostrom.
- SIA. "All other things equal, an observer should reason as if they are randomly selected from the set of all possible observers." Quote from Anthropic Bias, written by Bostrom.
- ADT. "An agent should first find all the decisions linked with their own. Then they should maximise expected utility, acting as if they simultaneously controlled the outcomes of all linked decisions, and using the objective (non-anthropic) probabilities of the various worlds." Quote from Anthropic Decision Theory V: Linking and ADT, written by Armstrong.
For additional explanations about these theories, see Quantifying anthropic effects on the Fermi paradox.
Reviewing estimates
We try to balance looking at diverse estimation methods while focusing on the most recent works and distribution estimates. For context, we also include a few works that do not fully produce distribution estimates but only contribute towards producing them and label them as [Context].
Try-once steps + No propagation ~ Drake Equation Estimates
[Context] The Log Log Prior for the Frequency of Extraterrestrial Intelligences (Lacki 2016, 12 citations) argues for using a log log prior for the term of the Drake Equation (
is the fraction of Earth-like planets on which life evolves, it is linked to abiogenesis. is the fraction of planets with life on which intelligent life appears, it is linked to eukaryogenesis and noogenesis). They show this log log prior can still update quickly on possible observations, but they don’t update on any when producing estimates. They produce several versions of their prior by referencing different physical phenomena. For their most conservative prior, they argue for a minimum bound of
by counting possible astronomical microstates. Based on their priors only, they estimate the likelihood that the universe is crowded, getting estimates ranging from 1.4% to 47% chance of saturation, with a best estimate at 18%. [Anthropic theories covered: Non-anthropic]
Dissolving the Fermi Paradox (Sandberg 2018, 57 citations) produced distribution estimates for the Drake Equation, estimating the number of civilizations capable of interstellar communication in the Milky Way. They assemble past point estimates by independently sampling each parameter of the Drake Equation from values reported in the literature, producing an ensemble model. They fit log-uniform distributions for most Drake Equation parameters and argue for a specific distribution for (the rate of abiogenesis per lifetime of a habitable planet), producing a baseline distribution estimate. They finally apply various Fermi Observation updates (we have not observed any SFC) and produce their lower density estimate when using a “settlement update”, which updates on observing that no nearby spacetime volume has ever been permanently settled. This last estimate assumes a propagation model in which only SFCs appearing in the Milky Way can propagate to it in a short time T and never go extinct (no intergalactic travels here). (see density estimates in Appendix A.1) [Anthropic theories covered: Non-anthropic]
Time-dependent steps + No propagation ~ Bayesian analysis of occurrence time
[Context] An objective Bayesian analysis of life's early start and our late arrival (Kipping 2020, 46 citations) estimates the odds of abiogenesis to be "slow" or "fast" and similarly for the rate of intelligent life appearance on Earth. All their results assume the same initial conditions as Earth and thus ignore how rare Earth may be. This can be understood as approximating the term of the Drake Equation. They use the information we have about the first appearance of life on Earth (e.g., the microfossil record of Cyanobacteria at 0.94 By after liquid water on Earth, the 13C isotope depletion 0.3 By after liquid water) and the fact that if abiogenesis was "slow", we might not be able to observe it (anthropic effect). They estimate that "fast" abiogenesis is 3 times more likely than "slow" and that "rapid" intelligence apparition is 3/2 less likely than "slow". In a follow-up video (Kipping 2024), they use new evidence about the occurrence time of abiogenesis on Earth (e.g., estimates of LUCA appearance time using genetic clocks) and about the deadline for intelligent life to appear on Earth (e.g., the deadline after which water will no longer be liquid on Earth). Using these new values, they update their previous results, now estimating that "fast" abiogenesis is 10 to 15 times more likely than "slow" abiogenesis. [Anthropic theories covered: Non-anthropic]
The Timing of Evolutionary Transitions Suggests Intelligent Life is Rare (Snyder-Beattie 2021, 50 citations) uses the occurrence time on Earth of critical steps in the development of intelligent civilizations to produce Bayesian estimates of their rate of occurrence. They only consider transitions for which very large scientific uncertainty remains: abiogenesis, eukaryogenesis, sexual reproduction, and intelligence. They look at combinations of 2 to 4 of these hard steps. They use similar priors for each of these hard sequential steps. They importantly model the anthropic selection effect requiring our appearance time to be within Earth's habitability range. Under their main hypothesis, they estimate the probability of Earth having >1% chance of intelligent life appearing to be in the order of 3% (using non-anthropic theory). These estimates vary strongly upwards if they model the last hard step (intelligence) as happening only after some delays (e.g., atmosphere oxygenation), though they don't provide numerical estimates. While they don’t publish probability distributions of SFC density, they release distribution estimates of what can be considered an approximation of the term of the Drake Equation, thus allowing the construction of SFC density estimates. (see estimates of
in Appendix A.2) [Anthropic theories covered: Non-anthropic, SIA (no numerical value reported for SIA)]
Try-once steps + greedy propagation
Quantifying anthropic effects on the Fermi paradox (Finnveden 2019) models the number of SFCs emerging per Earth-like planet using some of the Drake equation parameters from Dissolving the Fermi Paradox, with conservative adjustments. The focus of their work is not on estimating the density of SFC without SIA update, and thus, they don’t improve much such estimate compared to this previous work. The main difference is in modelling space colonization through time and looking at the whole universe, not only at the Milky Way. They produce three main distribution estimates of SFC density: without updates, with a Fermi Observation update, and with an additional SIA update. Under their central scenario, and after updating on both the Fermi Observation and SIA, 95% of the resources Humanity’s SFC could reach will be reached first by other SFCs, and among the remaining 5% reached first by Humanity's SFC, 64%[1] could be reached later by other SFCs. Only 1.7% of the resources Humanity’s SFC could reach if no other SFC existed, would be lost if Humanity’s SFC didn’t exist. (see density estimate in Appendix A.3) [Anthropic theories covered: Non-anthropic, SIA]
On the Likelihood of Observing Extragalactic Civilizations: Predictions from the Self-Indication Assumption (Olson 2020, 8 citations) uses a dynamic propagation model and focuses on estimating the hypothetical impact of full-sky surveys. They don’t focus on improving non-anthropic estimates of SFC density and simply assume a log uniform prior distribution of SFC densities, whose bounds are respectively and
. Different bounds within these constraints don’t change their result. They then update on the Fermi Observation and SIA. They show that even after updating on a hypothetical full-sky survey detecting no SFCs, and if assuming SIA, then a large fraction of the universe is, in the present time, saturated by SFC (eyeballing ~50%). The (SIA-updated) SFC density is only updated downward by around one order of magnitude in the case of this hypothetical survey. (see relative density estimates in Appendix A.4) [Anthropic theories covered: Non-anthropic, SIA]
Time-dependent steps, greedy propagation ~ Grabby Alien Models
If Loud Aliens Explain Human Earliness, Quiet Aliens Are Also Rare (Hanson 2021, 15 citations) has the possible merit of explaining why Humanity seems to have appeared early, given the lifetime of stars in the universe (M (red) and K-type (orange) stars). In this model, the appearance of intelligent life in the universe has a deadline when all resources are grabbed by SFCs, which prevents new SFCs from appearing. They model the appearance of SFCs as a hard-step process (3 to 12 hardsteps, 6 as a conservative middle estimate). This model is a variation of Olson's models, with the addition of the hard-step power law. They didn’t release numerical estimates of the density of SFCs. [Anthropic theories covered: SSA (Reference Class: Intelligent Civilizations)]
Replicating and extending the grabby aliens model (Cook 2022) uses the Grabby Alien Model and Olson’s dynamics of expanding spheres to produce density estimates with Fermi Observation and SSA, SIA, ADT updates. The overall model is further extended by adding delay steps and try-once steps to the hard-step model. Density estimates are made possible by using additional distributions: the habitability around stars with various lifetimes, distributions over the number of steps in the appearance model, distributions of the intergalactic travel speed, etc. The decision-relevance weighting used with ADT uses the resources grabbed by SFCs descending from our perfect copies as a proxy for impact. Using ADT and total utilitarianism, they estimate that around 84% of the resources that Humanity’s SFC could reach could also be reached by other SFCs. (see SFC density estimates in Appendix A.6) [Anthropic theories covered: Non-anthropic, SSA (Reference classes covered: Minimum, Intelligent Civilizations, and All agents), SIA, ADT]
Which estimate is the most conservative?
How to compare estimates?
Let’s convert the reviewed density estimates into the same unit: the peak cosmic density of SFCs per observable universe volume. The density is computed after all SFCs appear, and in practice while assuming none disappear, thus “peak”. We ignore local fluctuations in densities, thus "cosmic". The volume of today's observable universe is computed in co-moving distance. For simplicity, we call this unit: “SFC density”.
- Sandberg 2018 reports the density of SFCs in the Milky Way at the present time. To convert this into the density of potential SFCs per observable universe, we can multiply their value by around .
- The number of galaxies in the observable universe is estimated to be around 2 trillion (Big Think).
- The conversion above is insufficient to correct the initial results, which are about the density of SFC at our present time. This estimate is thus bearish, ignoring the SFCs that could appear in the future. Though this estimate could also be ignoring SFC extinctions events, like possible events happening before an SFC becomes inter-galactic, H.T. Miles Kodama.
- Finnveden 2019 reports the “frequency of planets yielding SFCs” and jointly uses the “rate of Earth-like planets formed per year per cubic megaparsec” to run propagation simulations constraining SFC appearance. Using the values reported in their work, we can transform the “frequency of planets yielding SFCs” into (potential) SFC density by multiplying the first by the number of Earth-like planets in the observable universe (~).
In the observable universe, there are approximately: stars (Finnveden 2019), to stars (Wikipedia), stars (Big Think), and Earth-like planets (approximated from Finnveden 2019)[2], to star-orbiting planets, and to starless planets (Big Think).
- Olson 2020 reports appearance rate per of co-moving distance per Gyr of cosmologic time. We can convert this into SFC density by multiplying this value by 4 million.
- The observable universe is 93 Gly in diameter and thus 420k Gly3 in volume. The cosmic scaling factor, correcting for inflation, is very close to one since we are using the volume of the observable universe in the present time. For the conversion, as an approximation, we also assume that the universe produces SFCs during 10 Gyr of cosmic time. Given this assumption, the appearance rate of SFCs in the observable universe (over its full history) is around 4 million times higher than the appearance rate per per Gyr. This neglects any preclusion effect that early SFCs can have on later potential SFCs, making this estimate bullish.
- Cook 2022 directly reports probability distribution over SFC density per observable universe. We don’t need any conversion.
Bearish and best-guess non-anthropic estimates
Which non-anthropic distribution estimate is the most bearish, and which would be our best guess? We start with four works reporting distributions. We will ignore the distribution from Olson 2020 since it is a simple log uniform prior distribution over all the orders of magnitudes to which their model is sensitive. Let’s note that we are only interested in distributions updated on the Fermi Observation.
We analyse different ways in which the three remaining results are bullish (higher density of SFC), central, or bearish (lower SFC density).
- Update on the Fermi Observation:
- [Significantly bullish] Sandberg 2018 only updates on a weak version of the Fermi Observation: We don’t observe any settlement in our galaxy.
- [Central] Finnveden 2019 and Cook 2022 update on the stronger version of the Fermi Observation: We don’t observe any SFC in our past light cone.
- Estimating
:
- [Central] Sandberg 2018 states they use a bullish prior for
in the Drake Equation (median equal to 1). However, their distribution matches that of the empirical distribution of values in the academic literature, so it is unclear how bullish their choice actually is. We thus label their choice as central, not an bullish.
- [Significantly bearish] Finnveden 2019 uses a much more lower prior for
than Sandberg 2018 (median equal to , instead of 1).
- [Central] Cook 2022 does not use the Drake Equation but instead, a model mixing many types of steps (hard and easy try-try, try-once, delay, fuse).
- [Central] Sandberg 2018 states they use a bullish prior for
- Final time
- [Bearish but effect unclear] Sandberg 2018 reports the density of SFC at our current time, not after all SFC appeared, thus producing a bearish estimate.
- [Central] Finnveden 2019 and Cook 2022 report the SFC density at .
- Propagation speed
- [Unclear] Finnveden 2019 (in the results presented here) uses a propagation speed of 0.8 times light speed.
- [Central] While Cook 2022 uses a prior over speeds.
- Number of stars per observable universe
- [Bearish but effect unclear] Finnveden 2019 uses an estimate of stars in the observable universe, while other estimates range from to .
- [Unclear] Sandberg 2018 and Cook 2022
- Prior over Humanity appearance rank
- [Unclear, plausibly bearish] Finnveden 2019 models the time for an SFC to appear on a planet as a Gaussian centre on 4.55 By, which is Humanity's appearance delay on Earth. This differ from the intuitive prior that Humanity's appearance rank should be uniformly sampled among all ranks (before updating on anything). This method pushes Humanity's SFC to be very close to the 50th percentile of appearance rank when the density of SFC is high. The impact of this choice on the density of SFC is unclear, but it seems to ignore the possibility of SFC appearing in the late future, thus plausibly being bearish.
Overall, Finnveden 2019 produces a bearish estimate using a try-once steps appearance model, Cook 2022 produces a central estimate using time-dependent steps, and Sandberg 2018 produces a plausibly bullish estimate using a try-once steps appearance model.
Comparing estimates
We extract probability distributions over SFC density from existing works by extracting pixel positions in published graphs[3]. We plot all distributions in the following two sections using SFC density as the unit. We have two kinds of results:
- Actual-SFC density: The density including preclusion effects.
- Potential-SFC density: The density in case early SFCs don’t preclude “late” SFCs.
We conclude:
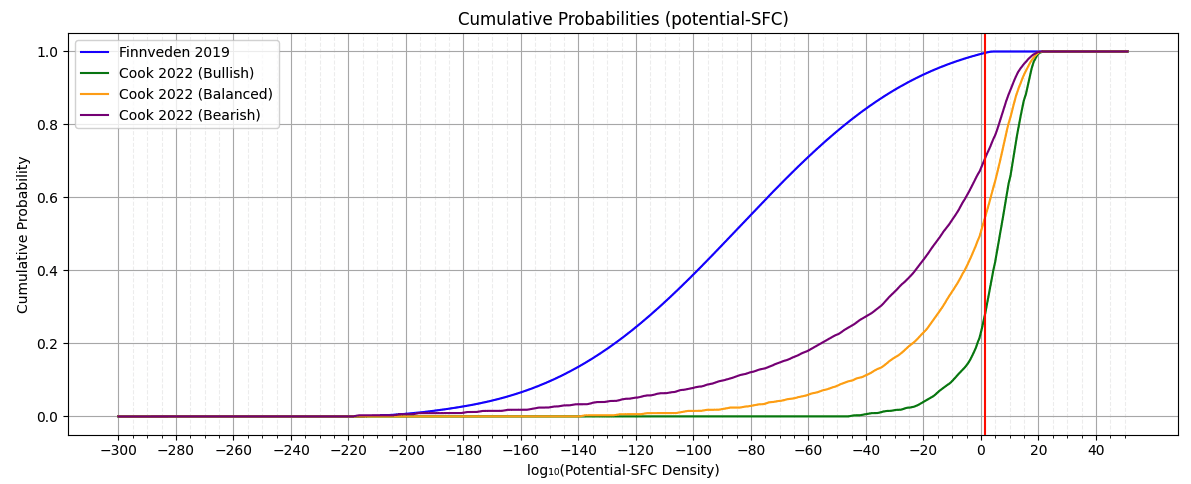
- Most bearish estimate: Finnveden 2019 (Potential SFC Density[4], Fraction of planets that yield a SFC, with Fermi Observation update)
- Best guess estimate: Cook 2022 (Potential SFC Density, Balanced priors, Fermi Observation v=c)
Actual SFC density estimates
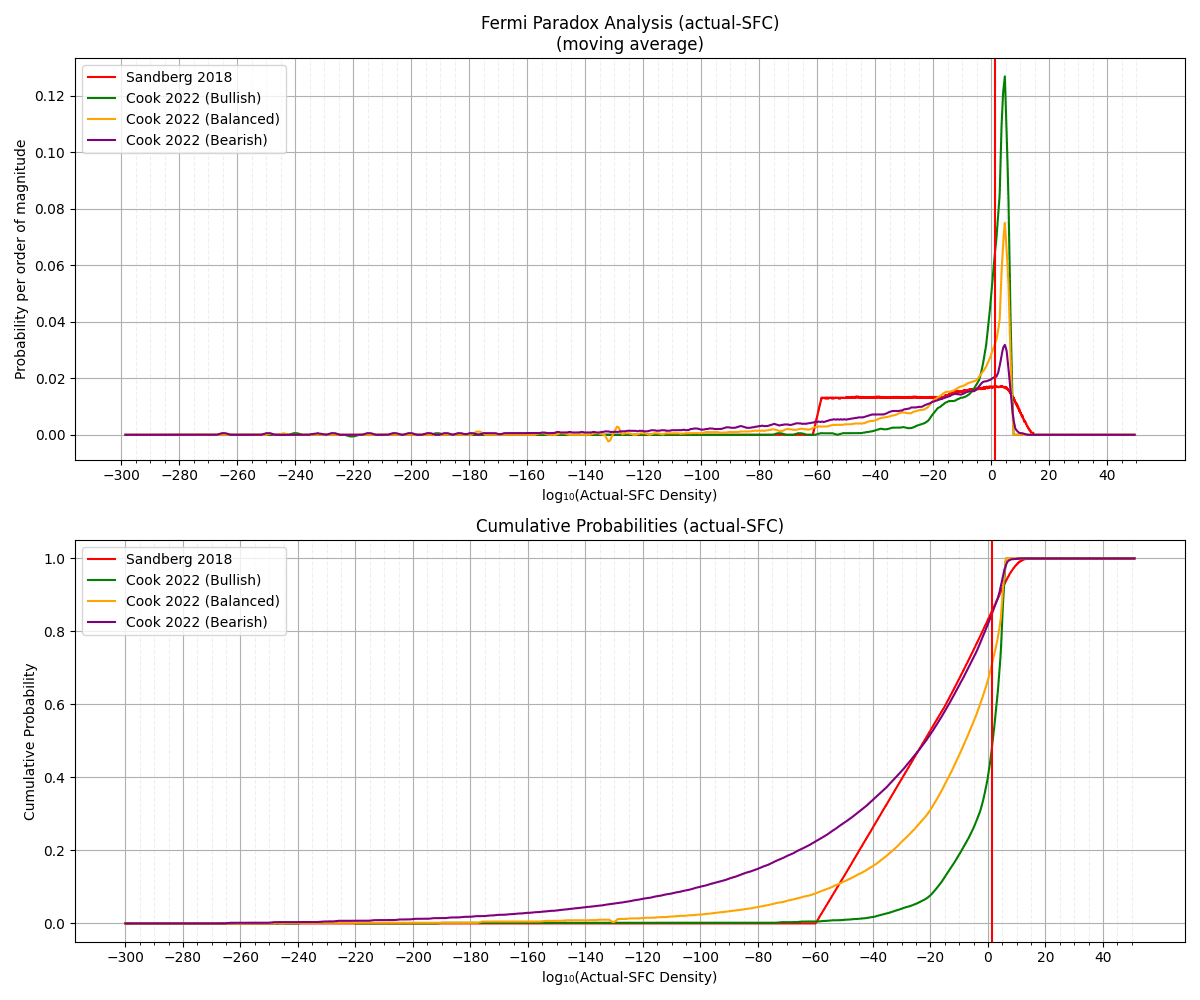
X: Log10(peak cosmic actual SFC density per observable universe).
Today's observable universe is around 20 times larger than today's reachable universe (assuming v=c). Thus, SFCs start to overlap around X = log10(20). See the red vertical line at this value for guidance.
Potential SFC density estimates
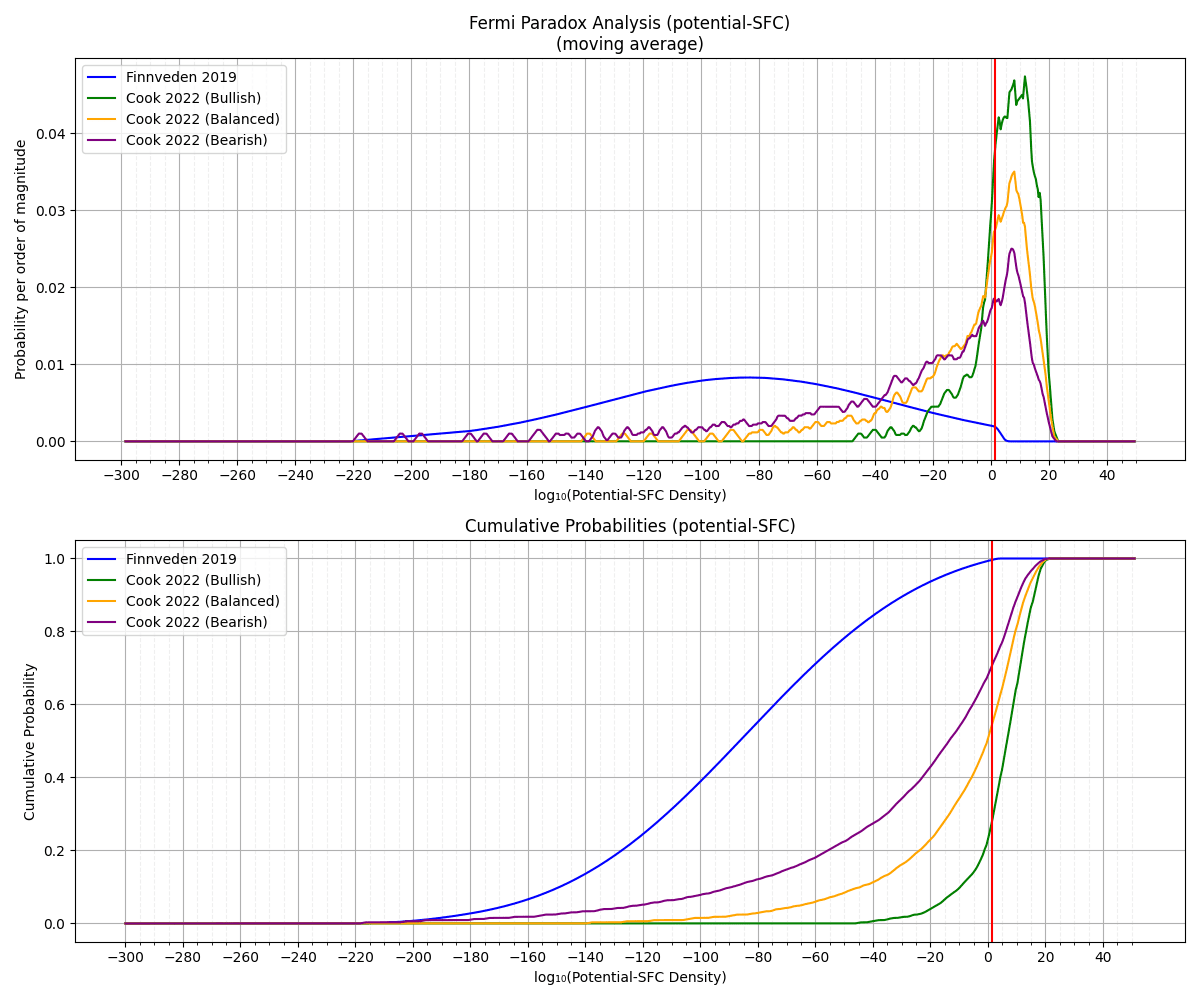
X: Log10(peak cosmic potential SFC density per observable universe).
Today's observable universe is around 20 times larger than today's reachable universe (assuming v=c). Thus, SFCs start to overlap around X = log10(20). See the red vertical line at this value for guidance.
Context
Evaluating the Neutrality Hypothesis - Introductory Series. This post is part of a series introducing a research project for which I am seeking funding: Evaluating the Neutrality Hypothesis. This project includes evaluating both the Civ-Saturation[5] and the Civ-Similarity Hypotheses[6] and their longtermist macrostrategic implications. This introductory series hints at preliminary research results and looks at the tractability of making further progress in evaluating these hypotheses.
Next steps: A first evaluation of the Civ-Saturation Hypothesis[5]. Over this post and the next few, we are introducing a first evaluation of the Civ-Saturation hypothesis[5]. Starting by reviewing existing SFC density estimates and models producing them (current post) and clarifying the meaning and impact of Civ-Saturation on which possible world we should bet on.
Acknowledgements
Thanks to Tristan Cook and Miles Kodama for having spent some of their personal time providing excellent feedback on this post and ideas. Note that this research was done under my personal name and that this content is not meant to represent any organization's stance.
Appendix: Link
- ^
64% of the resources Humanity's SFC would grab first would not be lost if it did not come to exist. This value may seem low compared to the fact that in this model, 98.2% of all resources are grabbed by SFCs on average. This is explained by two facts: (Fact 1) Observing that planet Earth appears somewhat late compared to other habitable planets. See the figure 2 in Finnveden 2019. (Fact 2) This work assumes the delay necessary for a planet to create an SFC is a Gaussian centre on Humanity's appearance delay of 4.55 By. This causes Humanity's appearance rank to be extremely close to the 50th percentile when the density of SFCs is large. Note that this method deviates from the intuitive prior that Humanity's SFC rank should be sampled uniformly. Both these facts lead to modeling Humanity's SFC as a late SFC. And we know that the more late an SFC is, the larger the fraction of its resources that would be wasted if we did not exist. At both extremes, if we were by far the first SFC to appear, then 64% would be instead 98.3%, and if we were by far the last SFC to appear, then it would be replaced by 0%.
- ^
We start with the number of stars in the observable universe used by the author: . We then compute the number of Earth-like planets using the rule of three, The number of Earth-like planets is equal to the ratio between the density of Earth-like planet to the density of stars multiplied by the number of stars. We approximate the integral of both densities using pixel count under the curve after extending curves using tangents. Stars formation: 0.042876. Earth-like planet formation: . Number of Earth-like planets = . Let’s sanity check this value: There are around 12.25 × 10¹² cubic megaparsecs in the observable universe. Thus, the number of Earth-like planets is . Both methods produce estimates very close to each other. Another sanity check: Given estimates by (Big Think) of to star-orbiting planets and stars, the ratio of star-orbiting-Earth-like planet to star-orbiting-planet would be around: 0.5% to 0.05% (after adjusting for the difference in the initial number of stars used in both sources). That intuitively seems low but plausible.
- ^
Graphs are cleaned manually and when some range is missing (for very low SFC density), we extend current trends using straight lines.
- ^
To produce estimates of the potential density of SFC and not the actual density, we use their results from figure 5: Probability distribution over the fraction of planets from which an intergalactic civilizations will emerge, after updating on the Fermi observation.
- ^
The Civ-Saturation Hypothesis posits that when making decisions, we should assume most of Humanity's Space-Faring Civilization (SFC) resources will eventually be grabbed by SFCs regardless of whether Humanity's SFC exists or not.
- ^
The Civ-Similarity Hypothesis posits that the expected utility efficiency of Humanity's future Space-Faring Civilization (SFC) would be similar to that of other SFCs.