Say that we have a set of options, such as (for example) wild animal welfare interventions.
Say also that you have two axes along which you can score those interventions: popularity (how much people will like your intervention) and effectiveness (how much the intervention actually helps wild animals).
Assume that we (for some reason) can't convert between and compare those two properties.
Should you then pick an intervention that is a compromise on the two axes—that is, it scores decently well on both—or should you max out on a particular axis?
One thing you might consider is the distribution of options along those two axes: the distribution of interventions can be normal on for both popularity and effectiveness, or the underlying distribution could be lognormal for both axes, or they could be mixed (e.g. normal for popularity, and lognormal for effectiveness).
Intuitively, the distributions seem like they affect the kinds of tradeoffs we can make, how could we possibly figure out how?
…
…
…

It turns out that if both properties are normally distributed, one gets a fairly large Pareto frontier, with a convex set of options, while if the two properties are lognormally distributed, one gets a concave set of options.
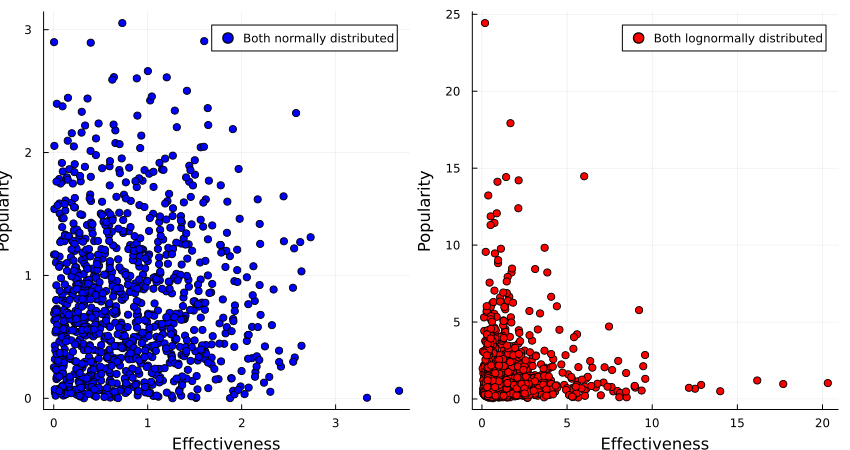
(Code here.)
So if we believe that the interventions are normally distributed around popularity and effectiveness, we would be justified in opting for an intervention that gets us the best of both worlds, such as sterilising stray dogs or finding less painful rodenticides.
If we, however, believe that popularity and effectiveness are lognormally distributed, we instead want to go in hard on only one of those, such as buying brazilian beef that leads to Amazonian rainforest being destroyed, or writing a book of poetic short stories that detail the harsh life of wild animals.
What if popularity of interventions is normally distributed, but effectiveness is lognormally distributed?
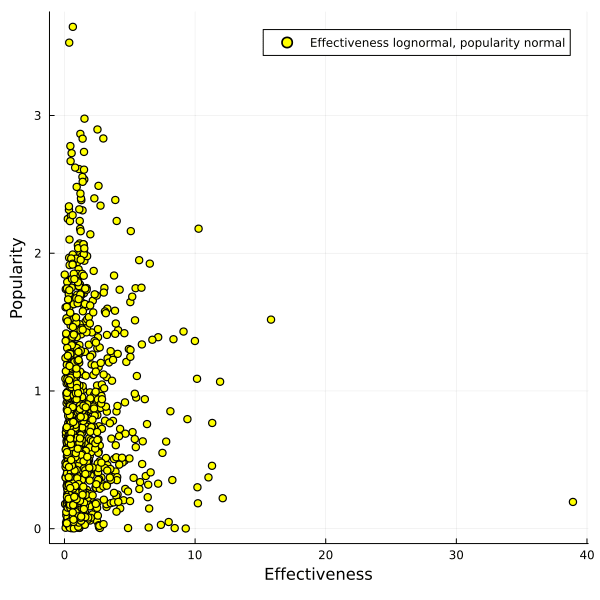
In that case you get a pretty large Pareto frontier which almost looks linear to me, and it's not clear anymore that one can't get a good trade-off between the two options.
So if you believe that heavy tails dominate with the things you care about, on multiple dimensions, you might consider taking a barbell strategy and taking one or multiple options that each max out on a particular axis.
If you have thin tails, however, taking a concave disposition towards your available options can give you most of the value you want.
@Lucius Caviola and I discuss such issues in Chapter 9 of our recent book. If I understand your argument correctly I think our suggested solution (splitting donations between a highly effective charity and the originally preferred "favourite" charity) amounts to what you call a barbell strategy.
Huh, the convergent lines of thought are pretty cool!
Your suggested solution is indeed what I'm also gesturing towards. A "barbell strategy" works best if we only have few dimensions we don't want to make comparable, I think.
(AFAIU It grows only linearly, but we still want to perform some sampling of the top options to avoid the winners curse?)
This is cool, thanks!
One scenario I am thinking about is how to prioritise biorisk interventions, if you care about both x-risk and non-x-risk impacts. I'm going to run through some thinking, and ask if you think it makes sense:
What do you think? I'm not sure if that reasoning follows/if I've applied the lessons from your post in a sensible way.
Thanks for the comment! The reasoning looks good, and was thought-provoking.
I think I disagree with you here. I model being bad at choosing good interventions as randomly sampling from the top n% (e.g. 30%) from the distribution when I'm trying to choose the best thing along the axis of e.g. non-x-risk impact. If this is a good way of thinking about it, then I don't think that things change a lot—because of the concavity of the frontier, things I choose from that set are still going to be quite good from a non-x-risk perspective, and pretty middling from the x-risk perspective.
I am very unsure about this, but I think it might look like in this image:
When you choose from the top 30% on popularity, you get options from the purple box at random, and same for options in the green box for effectiveness.
If you want to push axes, I guess you're going to aim for selecting from the intersection of both boxes, but I'm suspicious you actually can do that, or whether you end up selecting from the union of the boxes instead60%. Because if you can select from the intersection, you get options that are pretty good along both axes, pretty much by definition.
I could use my code to quantify how good this would be, though a concrete use case might be more illuminating.
Thanks! I'm now unsure what I think.
Isn't this an argument for always going for the best of both worlds, and never using a barbell strategy?
This isn't super concrete (and I'm not if the specific examples are accurate), but for illustrative purposes, what if:
I think a lot of people's intuition would be that the compromise option is the best one to aim for. Should thinking about fat tails make us prefer one or other of the extremes instead?
This seems like a very valuable bit of info to have!
I haven't thought about this for long, but I'm not actually sure which way a system like this would go.
I know that when a bunch of random variables are added together then that will result in a normal distribution, and when a a bunch of random variables are multiplied together it'll give a log-normal distribution, but I don't know which of these is a better model for different pain intensities in a given pain event
I think this link is informative: Charitable interventions appear to be (weakly) lognormally distributed in cost-effectiveness. In general, my intuition is that "charities are lognormal, markets are normal", but I don't have a lot of evidence for the second part of the sentence.