David_Moss
Bio
I am the Principal Research Director at Rethink Priorities working on, among other things, the EA Survey, Local Groups Survey, and a number of studies on moral psychology, focusing on animal, population ethics and moral weights.
In my academic work, I'm a Research Fellow working on a project on 'epistemic insight' (mixing philosophy, empirical study and policy work) and moral psychology studies, mostly concerned either with effective altruism or metaethics.
I've previously worked for Charity Science in a number of roles and was formerly a trustee of EA London.
Posts 32
Comments435
Thanks Geoffrey!
I think the mental health increase/decrease question (which was an external request) is not best interpreted with reference to the idea of a 'good baseline', since (as you are perhaps suggesting), I don't think it's clear what a good reference class would be for this (e.g. movements vary a lot in their composition and other potentially relevant characteristics).
I think it's better interpreted by comparison to what your expectations would be for the absolute pattern of outcomes within the EA community (e.g. some people seem to believe that EA often has a negative impact on the mental health of those involved), and is also potentially informative in terms of group differences and, in the future, could be informative in terms of changes within the EA community over time.
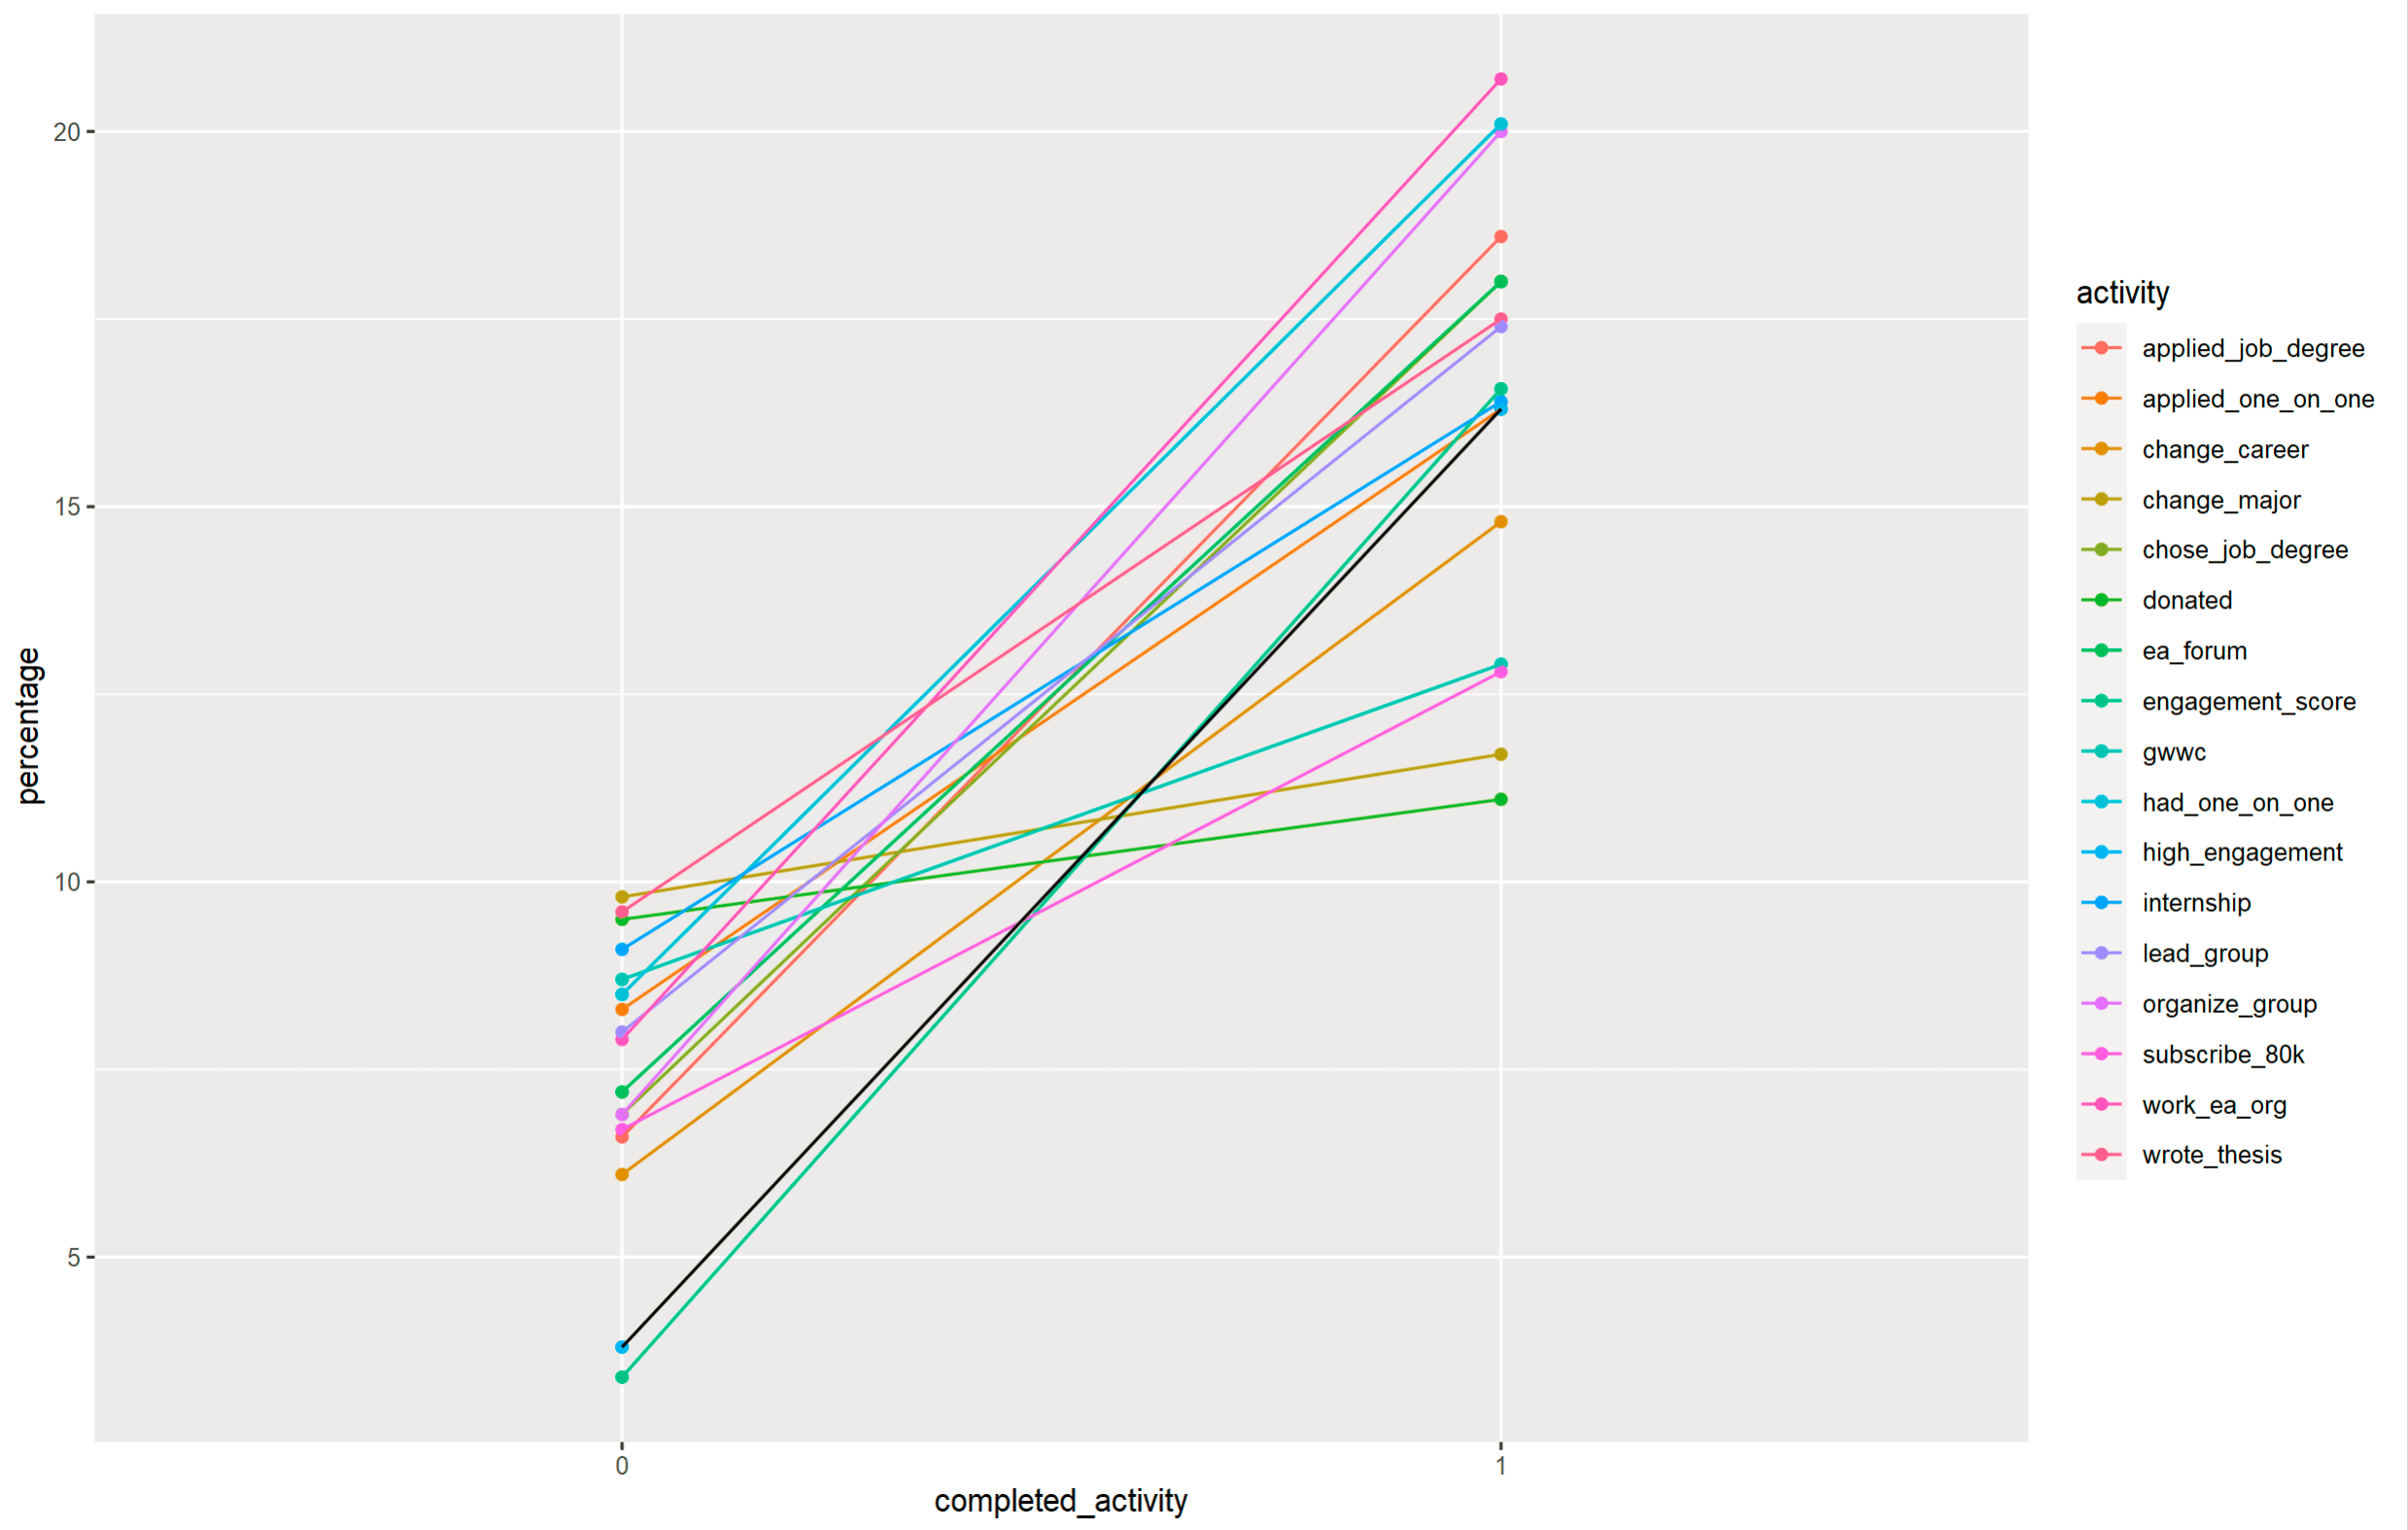
As another illustration, we can look at the association between engaging in different activities related to EA and reporting that EAG is important for getting involved in EA. This just asks whether people have completed each activity (0 = no, 1=yes), so there's no possible circularity in the wording.
As we can see, people who have engaged in each of the individual the activities are much more likely to report that EAG was important for them getting involved.
In addition, I created a simple 'engagement_score' based on the number of activities individuals had completed (0=1SD lower below the mean, 1=1SD above the mean'). We can see that the results for the engagement_score are almost identical to the results for high_engagement on the self-reported engagement scale (in black).
For more discussion of the associations between and validation of the engagement measures see our 2019 and 2020 reports.
Can you say more about why you decided to categorize climate change as neartermist?
The short answer is that we did not categorize climate change as neartermist.
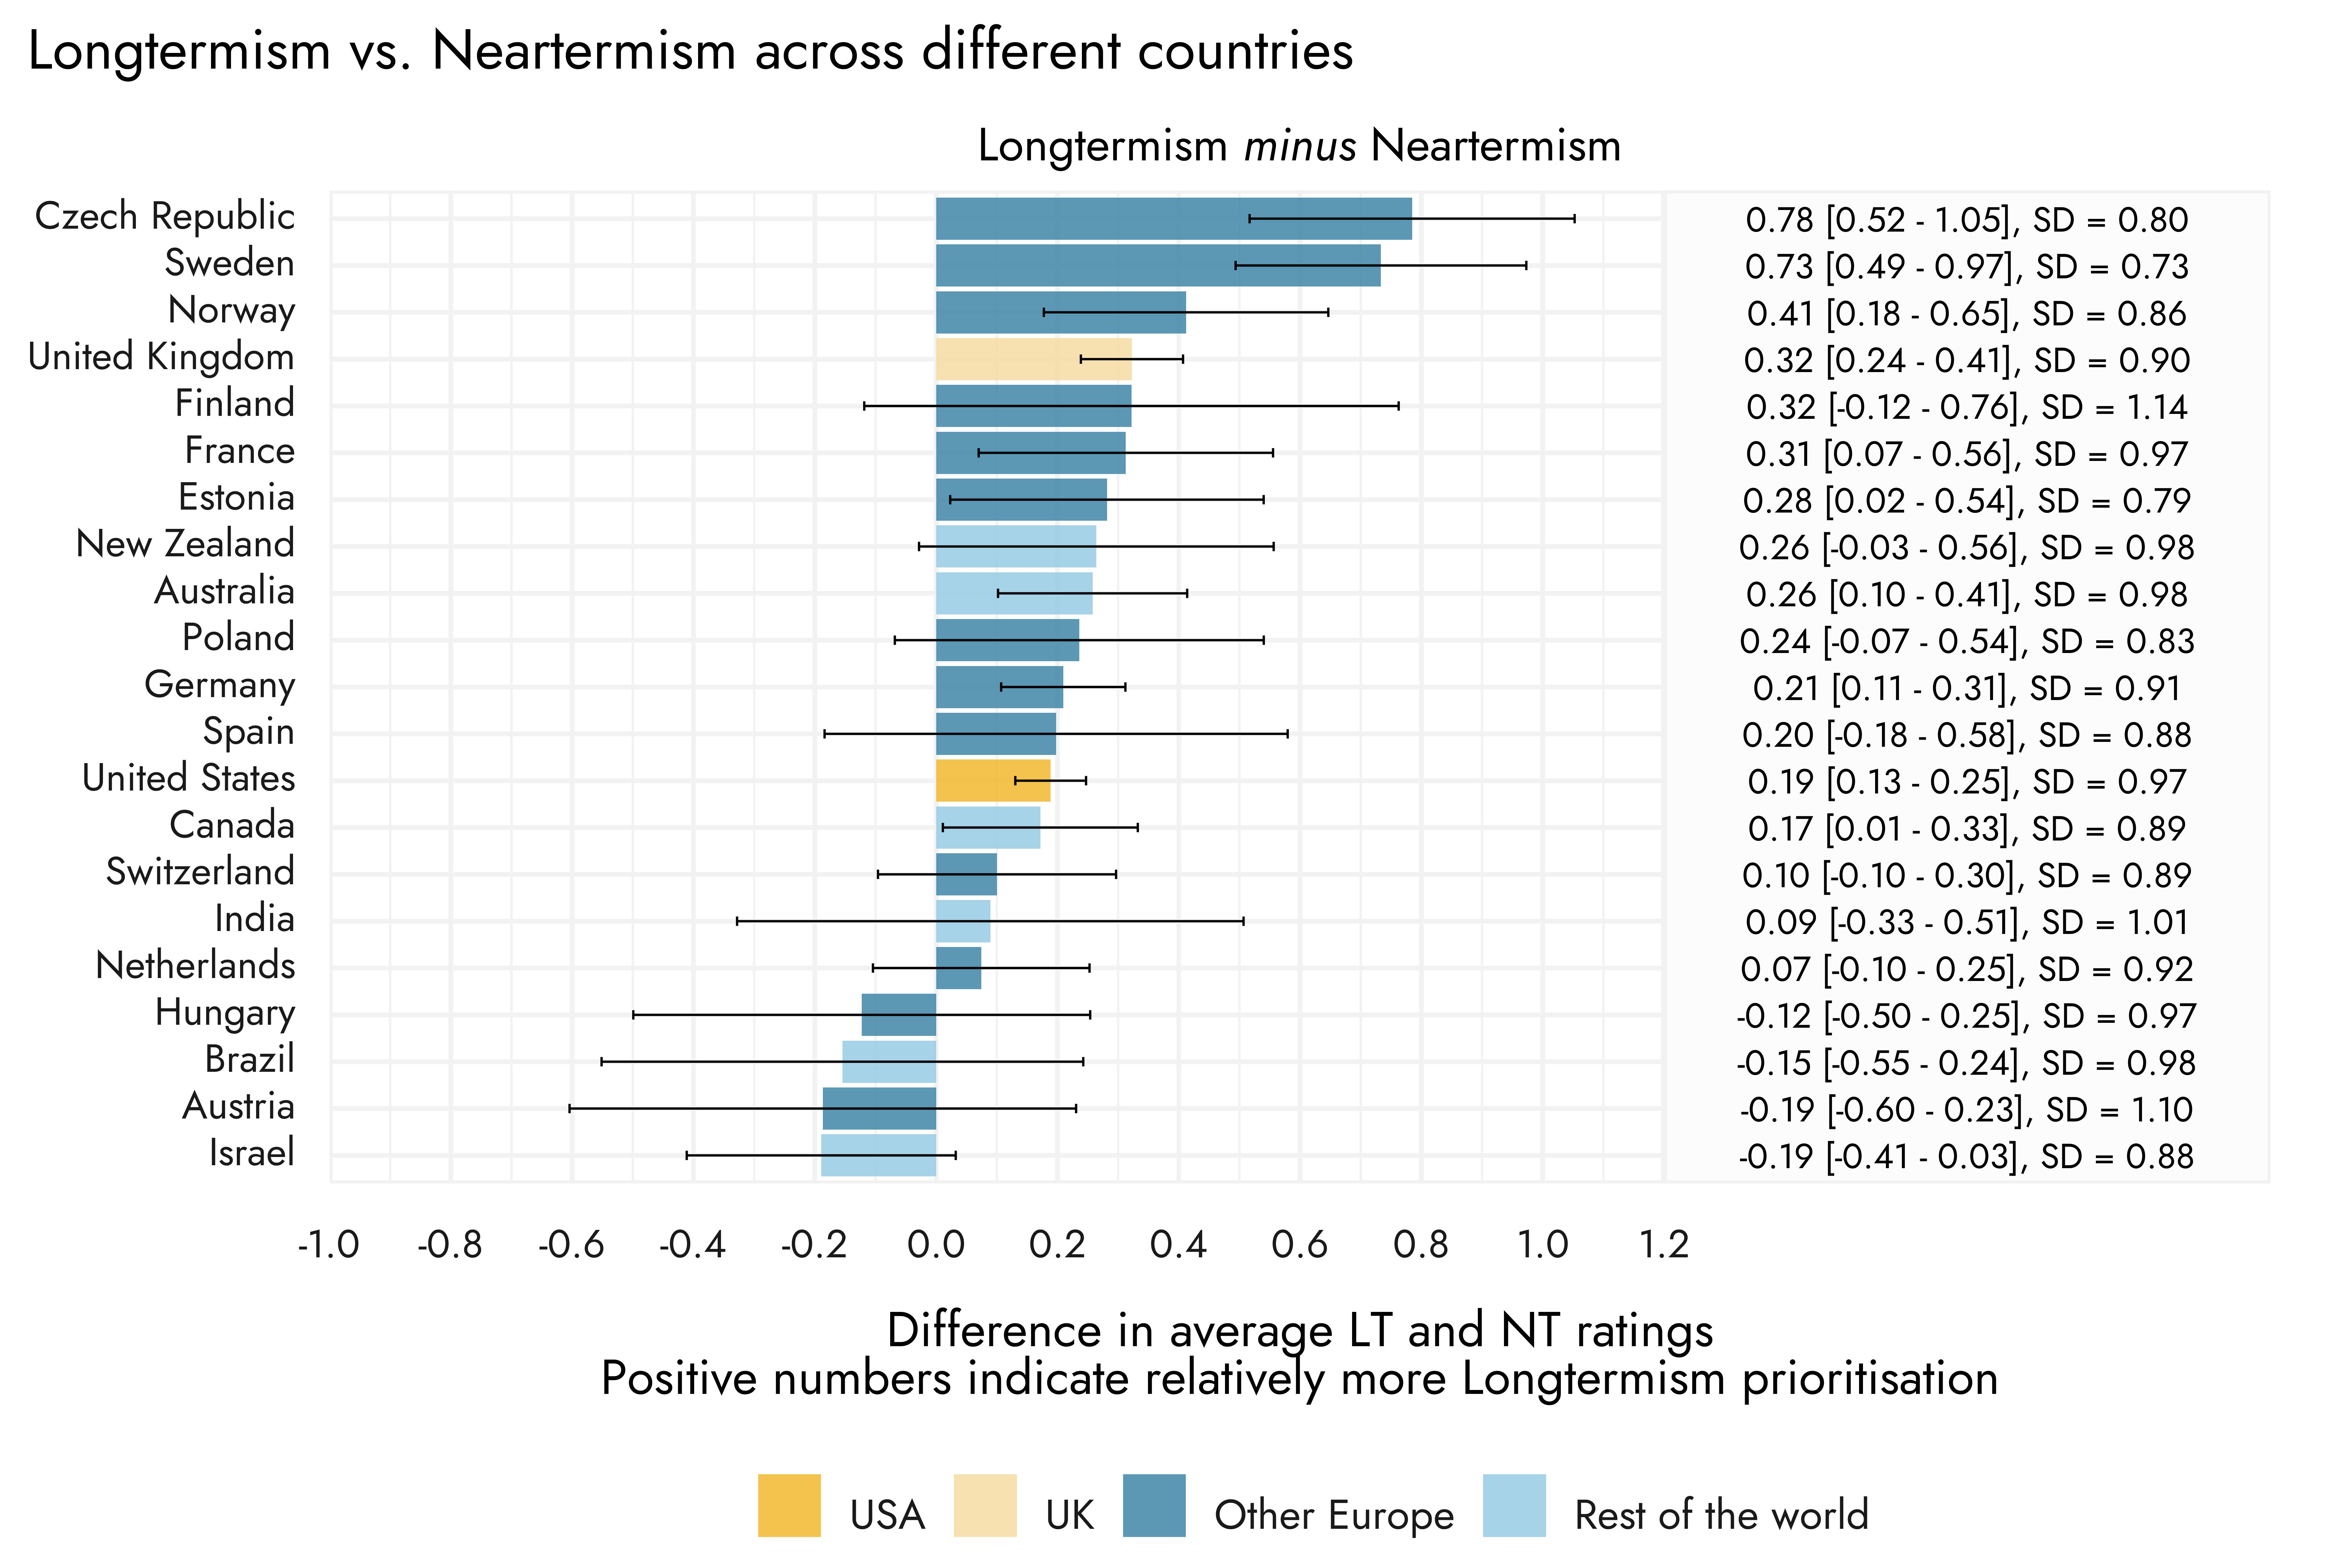
As we explain in this post, we calculated "the average of cause prioritization ratings for biosecurity, nuclear security, AI risk, existential risk, and ‘other longtermism’ to indicate prioritization of ‘Longtermist’ cause areas, and the average of global poverty / global health, mental health, and ‘other neartermism’ to indicate prioritization of ‘Neartermist’ cause areas."
I imagine the confusion may be due to you looking at our linked post from last year. We note in the text that the previous post also took the approach of "creat[ing] indicators of leanings towards broadly ‘longtermist’ cause areas, relative to more traditional ‘neartermist’/global health and wellbeing cause areas." But the specific list of causes we used is the one described in this post.
As to why Climate change is categorised among the neartermist causes: as we explain in the linked post, this was based on the results of an exploratory factor analysis, where Climate change loaded on the same factor as the other 'neartermist' causes, Global poverty and Mental health. So this is an empirical approach, rather than based on a priori classification.
Ironically, we did not include Climate change in the measure of neartermist preferences this year, in part, to avoid people complaining on theoretical grounds that Climate change should be a longtermist cause. That said, it still shows a clear positive association with endorsement of neartermist causes and a negative association with the longtermist causes. Perhaps most tellingly, it is also negatively associated with an explicit longtermist statement: "The impact of our actions on the very long-term future is the most important consideration when it comes to doing good."
Is it something like, the names are not literal (someone who is concerned that AI will kill everyone in the next 15 years seems literally more neartermist than someone who is worried about the effects of climate change over the next century) but instead represent two major clusters of EA cause prioritization with the main factor being existential impact?
Yes, we note in the text:
As we noted in our FTX Community Response Survey report, although we refer to these groups of causes as “longtermist” and “neartermist”, which they are often referred to as in the EA community, we are not committed to the claim that support for these causes is explained by longtermism/neartermism specifically. For example, support for “neartermist” causes might be explained by beliefs about appropriate kinds of evidence rather than beliefs about the value of the future per se.
GWWC team members have advocated for a "big tent" effective altruism where everyone who wants to do good effectively should feel that they can be a part of the community - but anecdotally we hear sometimes that people who are primarily interested in giving don't feel like the broader effective altruism community is the right place for them
Thanks for the comment. I would add that we also found signs related to this in our recent survey on responses to the FTX crisis (e.g. that there was divergence between more longtermist and more neartermist members of the community, with the latter less satisfied and more concerned in various ways).
We'll be discussing these issues in more detail in our forthcoming post about community satisfaction, retention and mental health.
I think this is one case where it's useful to also look at the absolute numbers from each source across years rather than the percentages. (Usually the absolute totals risk being very misleading/confusing, because the total numbers of respondents from different surveys varies a lot, e.g. 2020 was a nadir, with just over 2000 respondents, whereas in 2022 we recruited over 3500).
The raw numbers show similar numbers from GiveWell across years, whereas GWWC's raw totals do seem lower than their peak in earlier years. So it doesn't seem to simply be the case that they've been outpaced by faster growth from 80K or others.
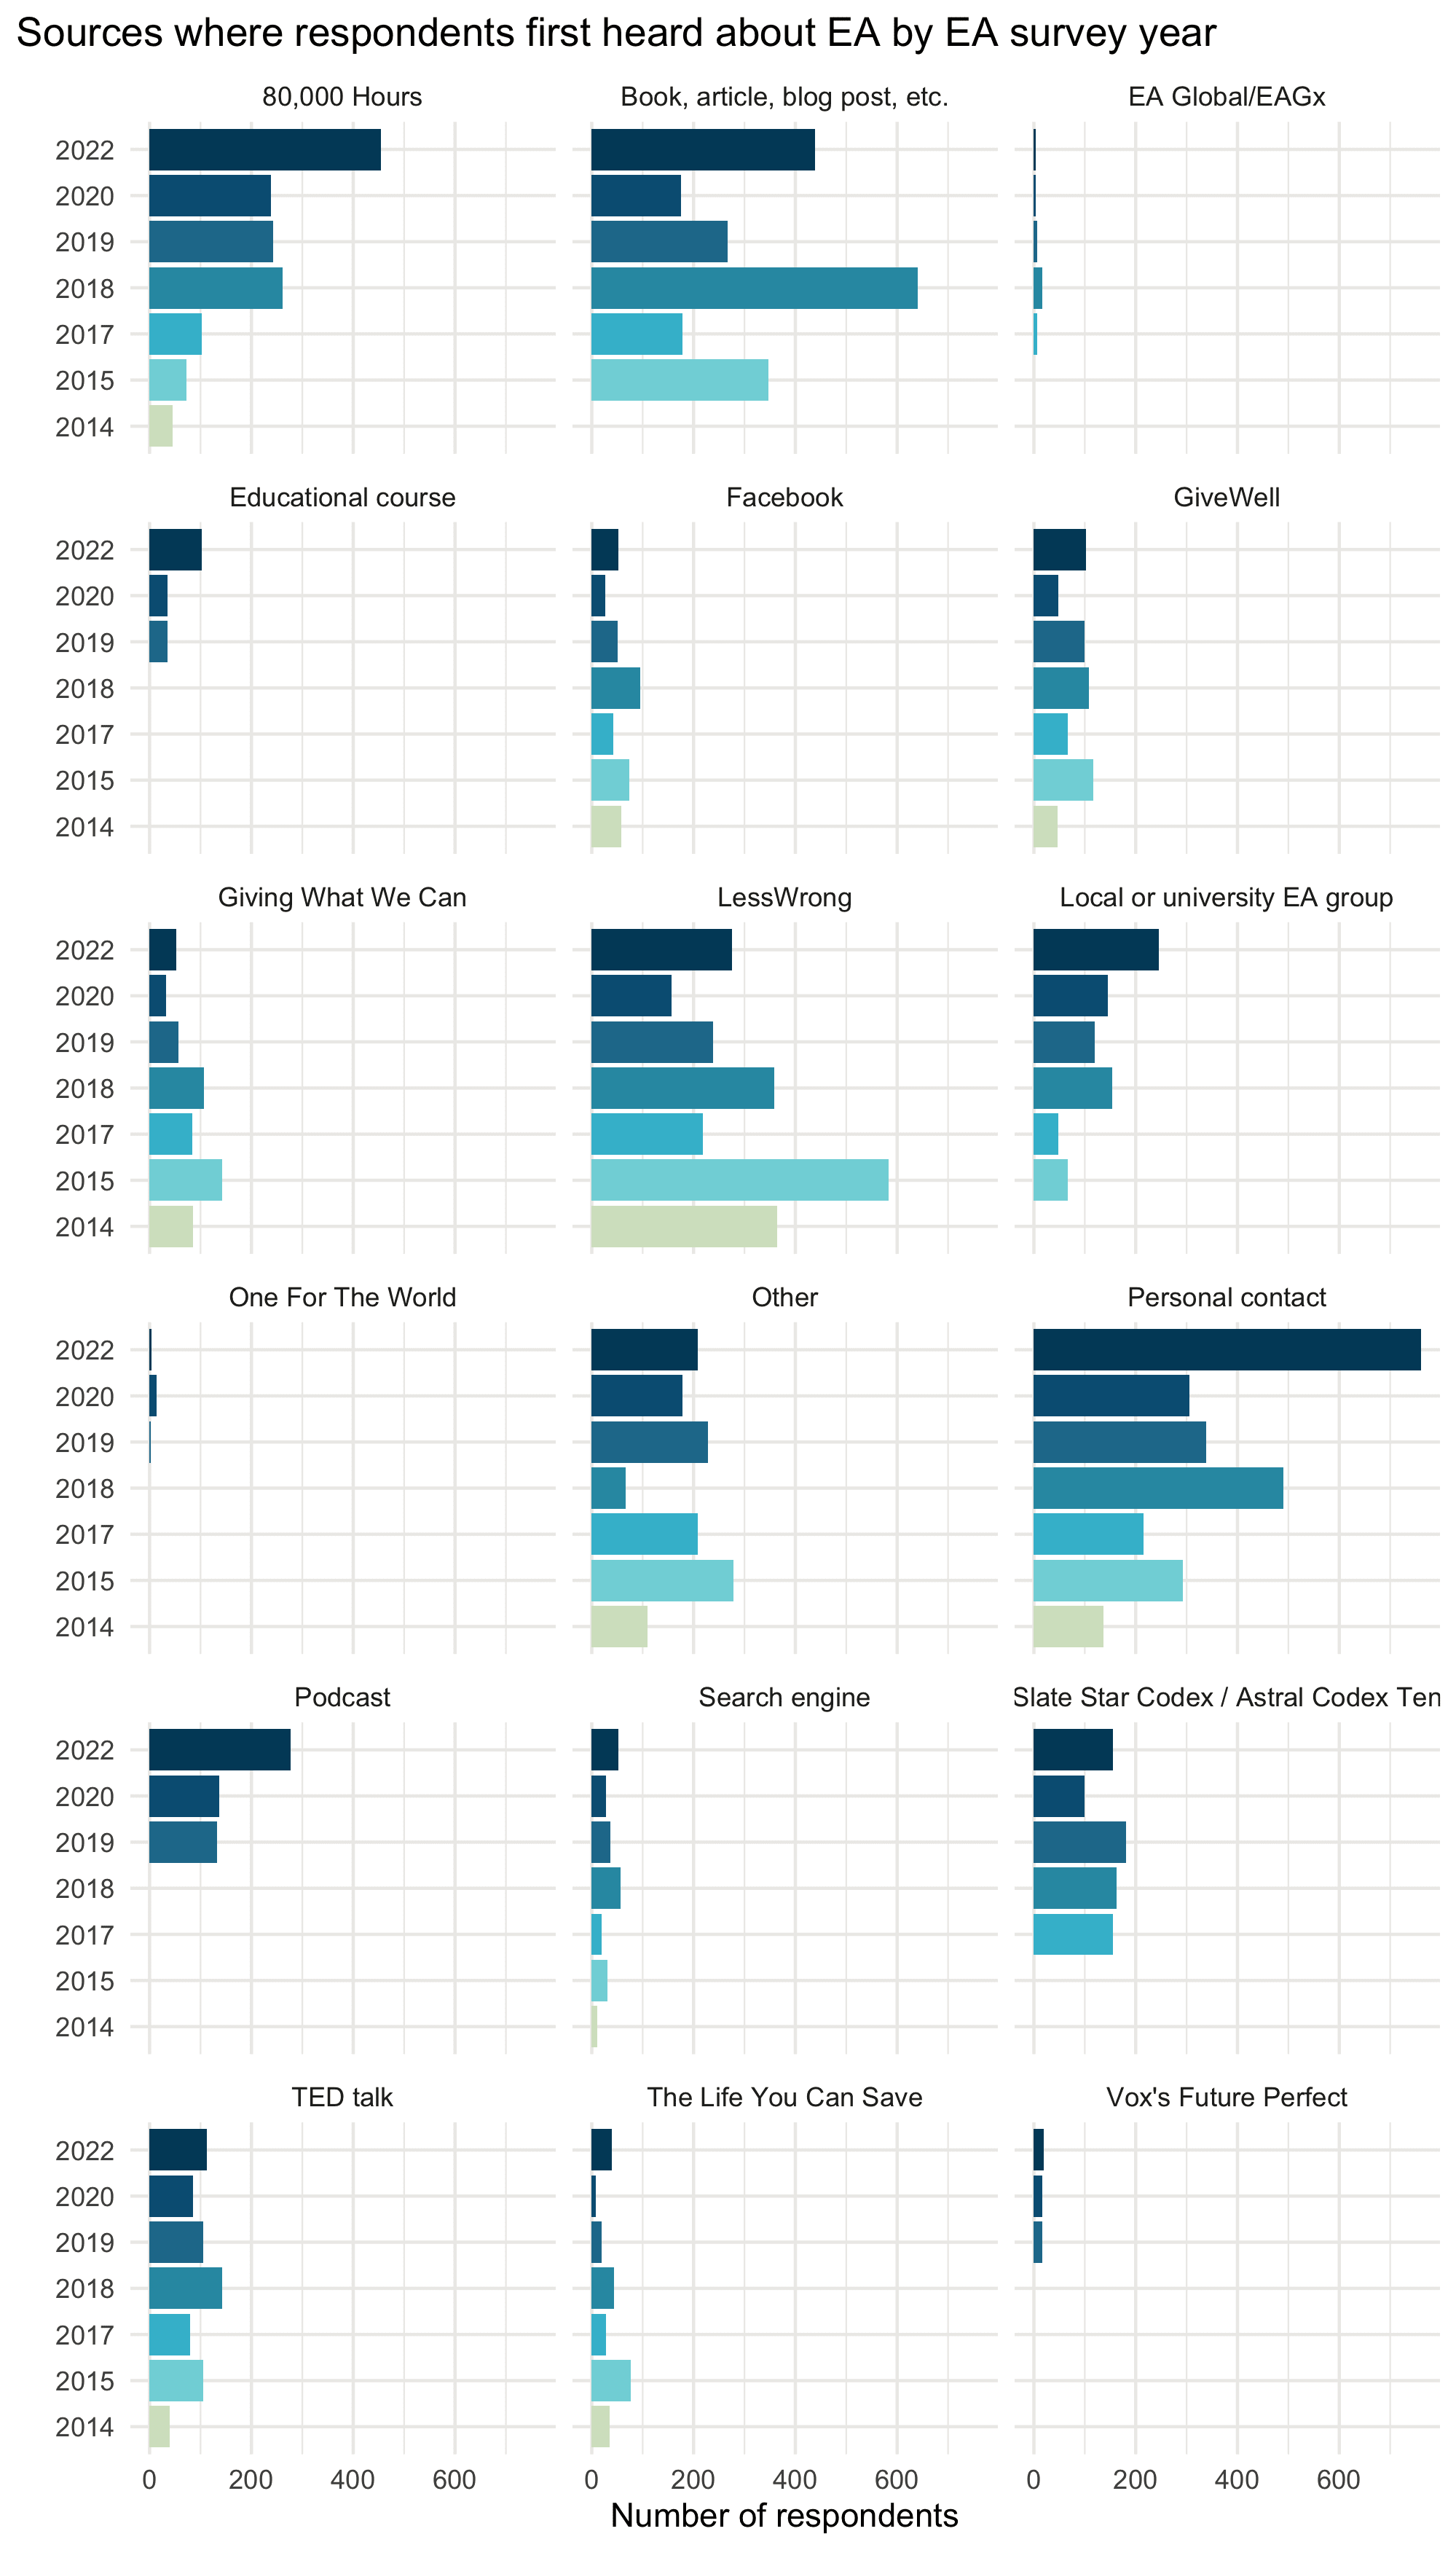
Although SSC/ACX has decreased in importance, I think it still recruited most of its respondents relatively late (partly due to starting later than other sources). e.g. SSC's peak was in 2017, but TED Talks recruited their most respondents in 2013 (mean years in EA for SSC = 3.8, mean years in EA for Ted Talk = 4.78). The case is more clear for podcasts (mean years in EA = 2.59).
That said, there was some evidence from last year's EAS of SSC respondents being lower engagement even in a model controlling for time in EA.
The most detailed discussion of this issue is in our bookdown from last year.
The survey is distributed with the help of a number of different EA orgs through a number of different channels (noted below). In this year's EA Survey, the EA Forum was the largest referrer, followed by 80,000 Hours, and then via a sharing link for respondents to share the survey with others. In previous years the EA Newsletter has been more dominant and my impression is that a big factor is simply the timing of when different sources are released (e.g. many respondents would either see the survey via the Forum or the Newsletter because they read both, and will simply take the survey via whichever they see first).
| source | n | proportion |
| EA Forum | 1033 | 28.97% |
| 80,000 Hours | 743 | 20.84% |
| Shared (by respondent) | 431 | 12.09% |
| No referrer | 282 | 7.91% |
| E-mail (previously participated) | 275 | 7.71% |
| EA groups | 266 | 7.46% |
| EA Newsletter | 216 | 6.06% |
| Other | 141 | 3.95% |
| Dank EA Memes (Facebook) | 121 | 3.39% |
| EA Facebook | 31 | 0.87% |
| LessWrong | 27 | 0.76% |
One of the most important factors (which is unrelated to the particular referrers above) is that the survey recruits relatively more highly engaged EAs than people who are less engaged. In particular, we recruit many more people who are moderately-highly engaged (levels 3-5), and very few with lower engagement (e.g. have read EA materials for a few hours). I think this makes perfect sense, since we would expect people who are more engaged with the community to be more likely to take the survey.[1] Given this, you would likely want to consult the analyses we provide on differences between low/high engagement respondents to get a sense of the differences. Unfortunately, there's no way to simply weight the results to get around this (as we could if we were doing a representative survey of the US public, for example), due to the simple fact that no-one knows what the real composition is of the full EA population including those with low engagement with EA.
The other area where recruitment methods are particularly significant is where the referrers to the survey are also categories of interest in the survey questions. For example, as we have discussed before, 80,000 Hours is a large referrer to the survey, which may influence responses to questions which mention 80K. In last year's post, we therefore conducted an additional analysis, where we found that removing 80K-referred people, lowered the proportion of people selecting 80,000 Hours, though still let them among the most important sources (moving them from 50.7% to 45% of respondents). As we noted in that post though, simply looking at the proportion who were not referred to the survey from 80K (or other factor) is likely to be a wild over-correction for the fact that people influenced by that factor were more likely to be referred to the survey from that factor.
If there's sufficient demand we could potentially produce another post looking at similar analyses, though my impression is that when we did so for last year's EAS there wasn't significant interest.
- ^
Though, as we note in the linked post, in practice, people may be primarily interested in the responses of those who are at least moderately engaged. Lower engagement would be someone who has e.g. "engaged with a few articles, videos, podcasts, discussions, events on effective altruism (e.g. reading Doing Good Better or spending ~5 hours on the website of 80,000 Hours)" but not necessarily engaged in any other way.
Thanks for your question Jessica.
There are no significant differences between the racial categories (unsurprising given the small sample sizes).